Auto Added by WPeMatico

K2 Compiler Performance Benchmarks and How to Measure Them on Your Projects

With the Kotlin 2.0.0 release drawing ever closer, the K2 compiler is now available for you to try! In this blog post, we explore the performance of the K2 compiler in various projects and give you the tools to collect your own performance statistics.

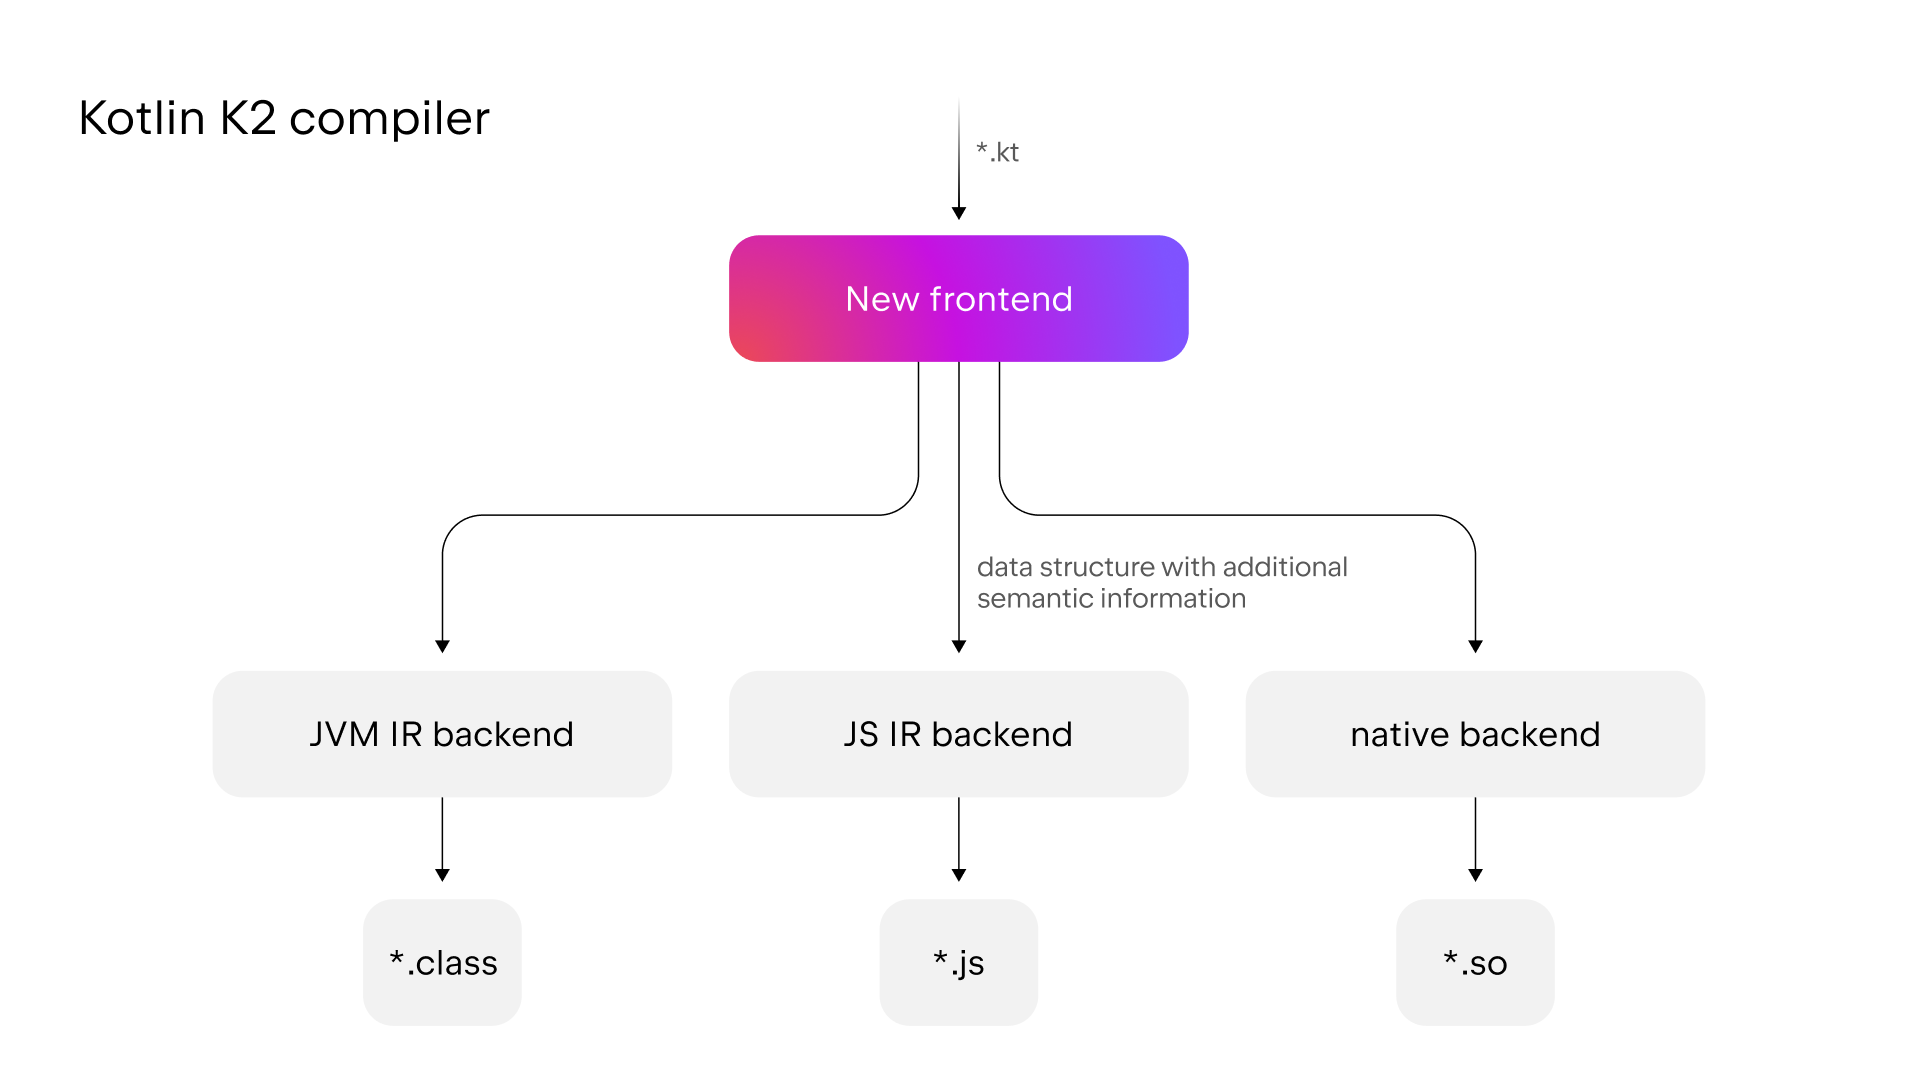
The road to the Stable version of the K2 compiler has been a long one. Since we made the decision to rewrite the compiler from scratch, we’ve added a new type inference algorithm, new JVM and JS IR (Intermediate Representation) backends, and finally, a new frontend.

The fundamental change in the frontend is the use of one unified data structure that contains more semantic information. This change makes compilation more efficient and helps IntelliJ IDEA analyze your Kotlin code.

Kotlin K2 Compiler

The driving force behind this initiative was the desire to speed up the development of new language features, unify all platforms that Kotlin supports, and improve performance for Kotlin developers.

To receive the full benefits of the K2 compiler in IntelliJ IDEA, enable K2 Kotlin mode. The K2 Kotlin mode is in Alpha, so not all IDE features are supported yet.

Key performance improvements

  • The K2 compiler brings up to 94% compilation speed gains. For example, in the Anki-Android project, clean build times were reduced from 57.7 seconds in Kotlin 1.9.23 to 29.7 seconds in Kotlin 2.0.0.
  • The initialization phase is up to 488% faster with the K2 compiler. For example, in the Anki-Android project, the initialization phase for incremental builds was cut from 0.126 seconds in Kotlin 1.9.23 to just 0.022 seconds in Kotlin 2.0.0.
  • The Kotlin K2 compiler is up to 376% quicker in the analysis phase compared to the previous compiler. For example, in the Anki-Android project, analysis times for incremental builds were slashed from 0.581 seconds in Kotlin 1.9.23 to only 0.122 seconds in Kotlin 2.0.0.

Set up

The Kotlin project that we used to run performance tests is available on GitHub. If you’d like to use it to collect your own statistics from your Kotlin projects, see Collect your own measurements.

Projects

We ran our performance tests on the following open-source projects:

Tools

To collect performance measurements, we used the Gradle Profiler.

We also used Kotlin build reports to collect detailed measurements about the different compilation phases.

Test scenarios

We created three scenarios to cover the most common compilation activities in a Kotlin project:

  1. Clean build: We built the whole project from scratch without using any pre-set configuration or build cache. This scenario happens when you compile a project for the first time or after you’ve made a project configuration change.
  2. Incremental build with no ABI (application binary interface) changes: We made changes in one file, but the changes were such that no further subprojects need to be recompiled.
  3. Incremental build with ABI changes: We made changes in one file, but these changes meant that a module needed to be recompiled because the external interface of the module was modified.

We compared performance data collected from Kotlin 1.9.23 and Kotlin 2.0.0 and used Gradle 8.5 throughout.

The Gradle configuration cache, project isolation, and build cache were disabled for all scenarios. Before the performance measurements were collected, we completed 10 warm-up rounds. We performed 10 measurement rounds in total.

Types of measurements collected

In addition to the total Kotlin compilation time and Gradle build time, our tests used build reports to collect data on the time spent by the compiler in each of its compilation phases:

Phase Description
Initialization The compiler initializes and reads all available symbols from the compilation classpath.
Analysis The compiler reads the source code, character by character, and breaks it down into meaningful tokens. These are analyzed to determine the structure of the code, after which the compiler performs semantic checks.
IR translation The compiler converts the semantic information into the internal representation.
IR lowering The compiler transforms the internal representation into a simpler form and finally de-sugars all special language constructs.
IR generation The compiler translates the optimized internal representation into the final bytecode.

Results

When comparing the results across our different scenarios and projects, we saw that Gradle build speeds were consistently higher by at least 9%. The most significant improvement was seen in the Anki-Android project, where the recorded build speed gains were around 20%, regardless of the compiler scenario.

Graph with Gradle build time for clean build scenario – Anki-Android Graphs with Gradle build time for incremental build scenarios – Anki-Android

Clean builds

The benefits of the new K2 compiler architecture were most clearly seen in the clean build scenario, with both projects compiling significantly faster in Kotlin 2.0.0.

The Exposed project demonstrated an 80% increase in compiler speeds, with compilation times falling from 5.8 seconds in Kotlin 1.9.23 to 3.22 seconds in Kotlin 2.0.0. Similarly, the Anki-Android project showed a 94% increase in compiler performance, as compilation times were cut to 30 seconds in Kotlin 2.0.0 compared to 58 seconds in Kotlin 1.9.23.

Graph with Kotlin compilation time for clean build scenario – Exposed Graph with Kotlin compilation time for clean build scenario – Anki-Android

Delving deeper into the performance of the different compilation phases, we found that the biggest improvement came in the analysis phase, with the Exposed and Anki-Android projects reporting speed gains of 156% and 194%, respectively. This is a direct result of the new unified data structure that we implemented in the K2 frontend. Since the new compiler only has to manage one data structure instead of two and has additional semantic information available to it, it’s unsurprising that we saw such an improvement here.

Graph with compilation breakdown for clean build scenario – Exposed
Blue = analysis phase
Graph with compilation breakdown for clean build scenario – Anki-Android
Blue = analysis phase

Incremental builds

For the incremental build scenarios, we also saw improved compiler performance. Especially in the case of the Anki-Android project, where compilation speeds increased by as much as 275% for both incremental build scenarios.

Graph with Kotlin compilation time for incremental build scenarios – Anki-Android

However, the results for the Exposed project weren’t as impressive. We saw a gain of just 35% for incremental builds with ABI changes and 7% for incremental builds without ABI changes, so there’s still room for improvement in this area.

While investigating the performance of the different compilation phases, we observed that the biggest performance gains were in the initialization and analysis phases, with each becoming around 400% faster in the Anki-Android project.

Graph with compilation breakdown for incremental build for ABI scenario – Anki-Android 
Graph with compilation breakdown for incremental build for non-ABI scenario – Anki-Android

Again, the Exposed project demonstrated a smaller improvement in the initialization and analysis phases, with a relatively modest 12%–55% performance boost. In fact, in the case of incremental builds with ABI changes in the IR lowering and IR generation phases, there was actually a performance degradation. However, the time taken in these phases is so little to begin with that we believe the impact to be imperceptible. For example, the IR lowering phase takes  0.01 seconds in Kotlin 1.9.23, rising to 0.014 seconds in Kotlin 2.0.0.

Collect your own measurements 

As we edge closer to the release of Kotlin 2.0.0, the spotlight is firmly on the K2 compiler, and it’s your turn to put it to the test. This section guides you through collecting your own Kotlin project performance statistics.

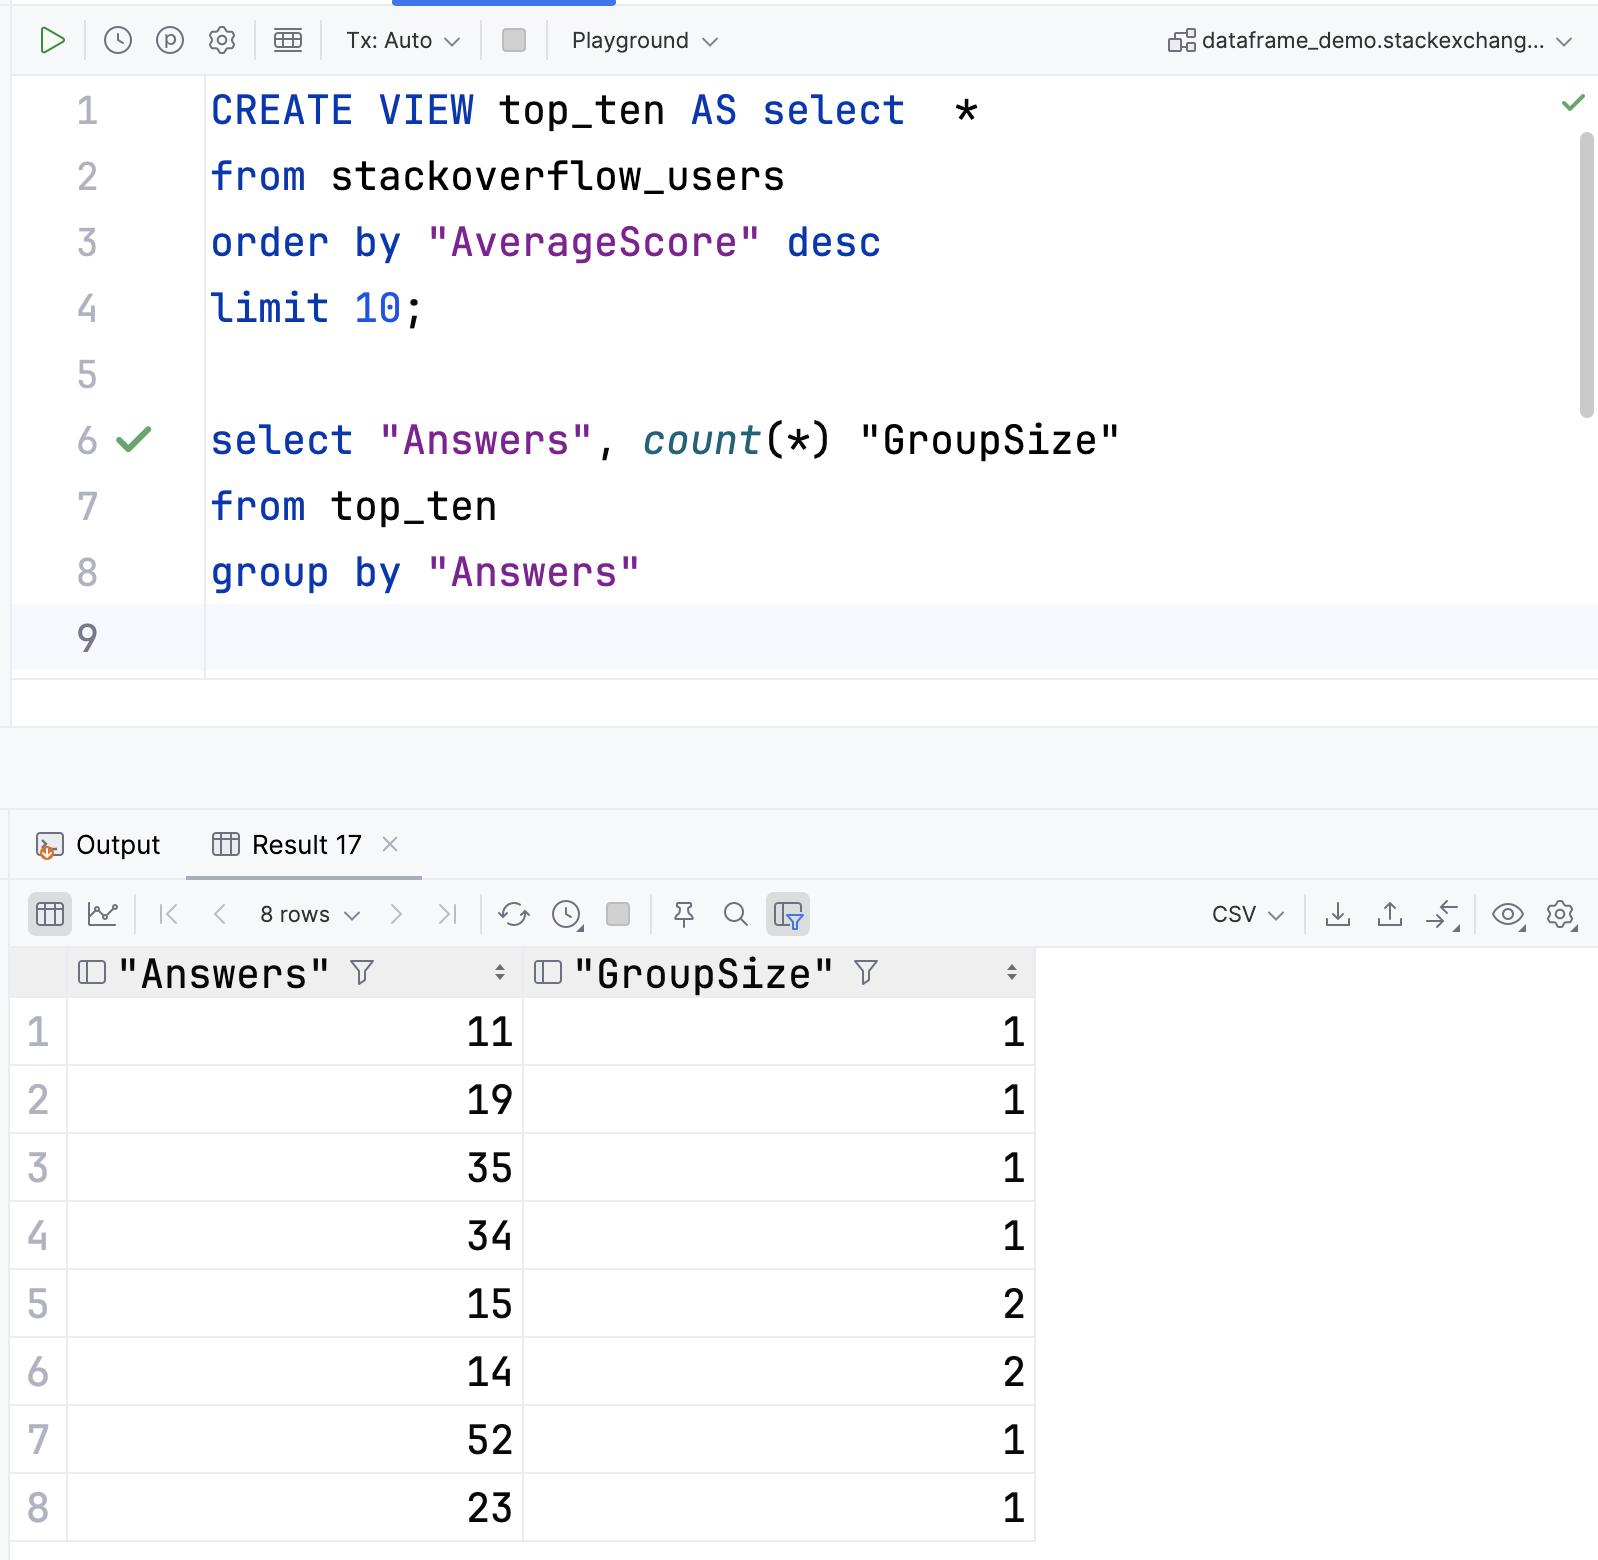
To facilitate an easy and quick benchmarking process for your own Kotlin projects, we’ve prepared a performance management tool especially for you. This is a Kotlin-based project that allows you to gather performance measurements for any Kotlin project, local or remote. By default, this project runs benchmark tests for Kotlin versions 1.9.23 and 2.0.0-RC1. However, you have the option to customize your own test scenarios as required. For visualization purposes, you can analyze the raw data generated by these scenarios, or use the provided Kotlin notebook for a more convenient visual representation.

Step 1: Open the project in IntelliJ IDEA

  1. Clone the k2-performance-metrics repository.
  2. Download and install the latest version of IntelliJ IDEA.
  3. On the IntelliJ IDEA welcome screen, click Open or select File | Open in the menu bar.
  4. Navigate to the k2-performance-metrics folder and click Open.

Step 2: Set up your project

  1. Verify environment variables:=
    1. Confirm that the JAVA_HOME variable is set, as it will be used to compile your project.
    2. Ensure that ANDROID_HOME is set if your project involves Android development.
  2. In the gradle.properties file, add the project that you want to collect measurements for in one of the following ways:
    • Add the local path in project.path.
    • Add the GitHub URL in project.git.url and the commit that you want the tests to run from in project.git.commit.sha.
  1. For the incremental build scenarios, add the path to the file where you’re making changes:
    1. scenario.abi.changes for the incremental build with ABI changes scenario.
    2. scenario.non.abi.changes for the incremental build without ABI changes scenario.

Step 3: Collect measurements

  1. In IntelliJ IDEA, open the Gradle tool window by selecting View | Tool Windows | Gradle.
  2. In Tasks | benchmarks, select and run the runBenchmarks task.
In Tasks | benchmarks, select and run the runBenchmarks task

Alternatively, you can run the following command in the terminal from the k2-performance-measurement root directory:

./gradlew runBenchmarks -t

By default, the build reports are available in the reports/{kotlin-version}/{scenario-name} folders.

If you want to create your own custom test scenarios, you can do so by extending the task class in your build.gradle.kts file. For more information, see the Create custom build scenarios section in the k2-performance-metrics repository’s README.md.

Step 4: Analyze your results with Kotlin Notebook

You need IntelliJ IDEA Ultimate to use Kotlin notebooks.

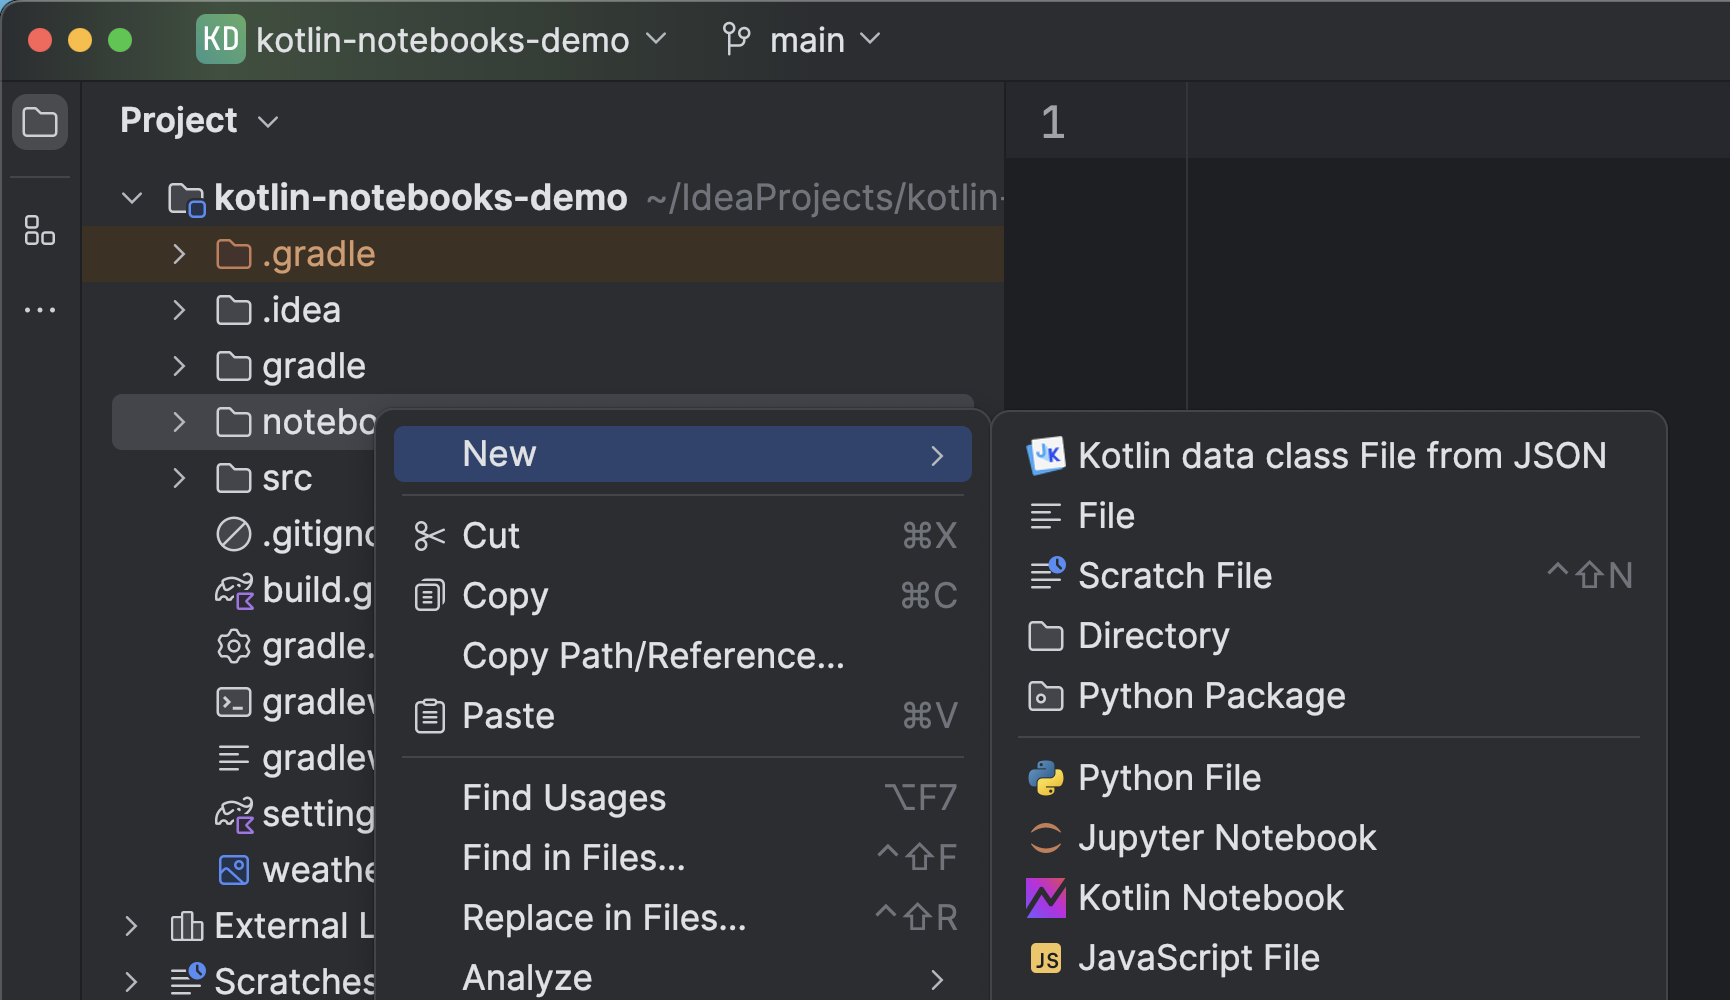
  1. In IntelliJ IDEA, go to Settings/Preferences | Plugins and select the Marketplace tab.
  2. In the search bar, search for “Kotlin Notebook” and select Install.
  3. Open benchmarkResult.ipynb and click the Run All button in the gutter to run all cells.
Run all

Conclusion

In summary, the new K2 compiler architecture can significantly reduce compilation times in your projects. This is particularly true for clean builds and the analysis phase of compilation, though Gradle build times are also shortened by the new compiler. Nevertheless, the degree of improvement that you’ll see will depend on your specific project. Some projects may enjoy a considerable increase in performance, while others may only experience modest gains.

Throughout our time working on the new K2 compiler, we’ve been constantly testing its performance on our internal projects. Additionally, EAP champions and early adopters have been testing it on their own projects, providing invaluable feedback on its performance and usability. 

Now, we’re asking you to try the K2 compiler and provide your feedback. We encourage you to join the #k2-early-adopters channel in our public Slack (get your invite here) for support and discussions.  If you’re facing specific problems or bugs, please don’t hesitate to create an issue in the Kotlin YouTrack project. Your feedback is invaluable in refining K2 and ensuring it meets the high standards and needs of our community.

What else to read and watch

Continue ReadingK2 Compiler Performance Benchmarks and How to Measure Them on Your Projects

A Step-by-Step Guide to Performing Data Analysis With Kotlin DataFrame

Introduction

This is the first in a series of tutorials on how to easily manipulate and visualize your data using the Kotlin DataFrame and Kandy libraries. The tutorials are aimed at regular Kotlin developers, so no previous experience of data analysis or similar frameworks (like pandas or Apache Spark) is necessary. You should, however, be familiar with the Kotlin language and have created Kotlin-based projects in IntelliJ IDEA previously.

In this tutorial, you will learn:

  • How to create a dataframe from a CSV file.
  • How to perform common operations.
  • How to display or export your results. 

You will be working within Kotlin Notebook, both for convenience and in order to have access to the Kandy plotting library. The core dataframe capabilities you will see are available in Gradle-based projects.

If you prefer, you can jump directly to the sample project, which contains data files and notebooks for all the tutorials in this series. However, developers who are new to DataFrame, may find it beneficial to build everything themselves from scratch, one step at a time. You can then compare your project against the sample project to ensure that you have built everything correctly.

All the tutorials use real-world data, which in this case, contains information about the top answerers on Stack Overflow. Please note that the results shown below are correct for the data that was downloaded at the time of writing and that is included in the sample projects. If you are fetching fresh data, then naturally this may contain updated values.

The sample data

You can obtain the sample data via the StackExchange Data Explorer. This allows you to run sample queries against a range of Q&A websites, including Stack Overflow. The results of your queries can be downloaded as a CSV file.

This sample query selects the top 500 users on Stack Overflow, based on an average score calculated against their answers to questions. Use the RunQuery button to execute the query, and then save the results via the Download CSV link:

StackExchange Top 500 answers on the site sample sata

Once you have downloaded the file, save it under the name Top500Answerers.csv.

Creating your project

Open IntelliJ IDEA and install the Kotlin Notebook plugin, as described in this blog post. Then, use the New Project wizard to create a new Kotlin project, with Gradle as the build tool. 

Copy the CSV file you created in the previous section into src/main/resources. You should be able to open the file in either the text or data views, as shown below:

The Kotlin Notebook plugin: opening a CSV file in IntelliJ IDEA

Hello, DataFrames!

Right-click on the project name and choose New | Kotlin Notebook. You can save the file as whatever you like. Then, add and run the following two lines:

%useLatestDescriptors

%use dataframe

The use command will now load and initialize the Kotlin DataFrame library for you. Many popular libraries can be loaded using their name alone, while other libraries can be loaded based on their Maven coordinates. A lot can happen when a library is loaded, so it is a good idea to do this in a separate cell.

Now you can create a new cell and add the following three lines:

val path = "./src/main/resources/Top500Answerers.csv"

val topFolks = DataFrame.read(path)

topFolks.head()

When you run these, the output should be similar to the one shown below:

Congratulations! You have just successfully built a dataframe from a CSV file and printed out the top five records.

Displaying Data in Kotlin Notebooks

Now that you have some data, let’s consider how you can display it in a Kotlin notebook.

You can render content as markup via the DISPLAY and HTML functions. The example below sorts the users, takes the top five, and prints their details as an HTML list:

fun htmlLink(text: String, url: String) = "<a href="$url">$text</a>"
fun soUrl(userID: String) = "https://stackoverflow.com/users/$userID"

val topFive = topFolks
   .sortBy { `Average Answer Score` }
   .tail()
   .reverse()

val content = buildString {
   append("<ul>")
   topFive.forEach {
       val userID = `User Link`.toString()
       val average = `Average Answer Score`
       val linkMarkup = htmlLink(userID, soUrl(userID))
       append("<li>User $linkMarkup with an average of $average</li>")
   }
   append("</ul>")
}

DISPLAY(HTML(content))

This is what should be displayed:

You should be able to click on any of the links to open a particular contributor’s page in your browser.

Displaying data as HTML is useful but requires effort to produce visually appealing results. As a simpler alternative, you can take advantage of the Kandy library to visualize the data. Let’s try it for our top five contributors using a bar chart.

First, load the Kandy library in a separate cell (for the reasons discussed above):

%use kandy

Then, plot the contributors, with their User IDs on the x-axis and their average answers on the y-axis:

plot {
   bars {
       x(topFive.map { "ID: $`User Link`" })
       y(topFive.map { `Average Answer Score` })
   }
}

This is what should be displayed:

Showing graphs using the DataFrame library

That is an impressive result for relatively little effort! Now that you have some idea of the power of the DataFrame library, let’s take a step back for a moment and review some core concepts.

What is a dataframe?

A dataframe is an abstraction for working with structured data. It is a table created by reading from a source such as a CSV file, a JSON document, or a database. The dataframe contains one or more named columns, whose content can be of different types. 

The content of a column can be any Kotlin object, including another dataframe. This feature allows you to store and manipulate hierarchical data.

The DataFrame API implements all the operations a functional programmer or database admin might require. The API is immutable, so any operation that has the potential to alter the dataframe instead produces a new instance. The underlying data is reused whenever possible for efficiency and performance.

One of the greatest strengths of the Kotlin DataFrame library is that it is typesafe. You can generate strongly typed extension properties that correspond to the columns in the dataframe. You will explore this in depth in the next section. 

Please note that when working in Kotlin Notebook, these properties are created on the fly. 

Accessing values in dataframes

The good news with dataframes is that, if you have previously used Kotlin collections or any modern data structures libraries, then you can immediately start work. All the standard operators of functional programming work as you would expect, right out of the box.

Let’s add up the total number of answers of all the contributors. Add and run a new code cell containing the expression below:

topFolks.map { Answers }.sum()

You can use the familiar map and sum operations to calculate the total. For the purposes of this demo, you could use the general-purpose reduce operator:

topFolks.map { Answers }.reduce { a, b -> a + b }

This should give you the same result as before. As discussed previously, properties have been added to the dataframe for each of the fields in the CSV file. These extension properties make it simple to access and manipulate the data in a type-safe way.

You can manage without these extension properties if required, for example, by creating column accessor functions:

val Answers by column<Int>()

topFolks.map { Answers() }.sum()

Standard operations with dataframes

Before we explore some more of the built-in operations, we should first clean up the data a little. You can rename the last two columns for clarity and convenience:

val topFolksClean = topFolks
   .rename { `Average Answer Score` }.into("AverageScore")
   .rename { `User Link` }.into("UserID")

topFolksClean

You should see that the column names have been modified:

Now, enter and run the expression below:

topFolksClean
   .filter { Answers >= 20 }
   .sortBy { AverageScore }
   .tail(3)
   .select { UserID }

As you can see, you have a chain of operations, which:

  • Filters the records to include only contributors that answered 20 or more questions.
  • Uses sortBy to sort the remaining records in ascending order by the average score.
  • Takes the top three results, which will be at the end of the sorted dataframe.
  • Extracts the IDs of the contributors into the final dataframe.

Your output should be similar to this:

If you are familiar with SQL then the select operation will make sense to you, although now it appears at the end of the statement. You can think of the filter operation as the equivalent of the WHERE clause and the sortBy operation as the equivalent of ORDER BY.

For example, given a database table in PostgreSQL, you could create and run the following query in DataGrip:

Creating and running a query in DataGrip

Note that the API contains both select and map operators for performing transformations.

distinct

From looking through the data you can see that the numbers of questions answered by contributors are not unique. For example, more than one contributor answered 15 questions. You can find out how many duplicates there are as follows:

topFolksClean
   .distinctBy { Answers }
   .count()

For the data at time of writing, this gives a result of 93, which means that the 500 contributors could be allocated into 93 groups, based on how many questions they answered. The distinctBy operation does not perform this grouping, it simply selects the first row from every group.

If you were to sort the contributors, by average answer score and in descending order, then the distinctBy operation should only select the highest-scoring contributor for each group. Let’s try to validate this, using the built-in operations.

You can first examine the original CSV file and pick a value from the Answers column, which occurs more than once. In this example, the repeated value is 15:

topFolksClean
   .filter { Answers == 15 }

This is the associated output. There are 22 rows, which the notebook will display in groups of 10.

In our results, the highest score for this group is 909.07, and the lowest is 58.33. When examining your own results, don’t forget to page through the whole dataset! 

If you sort in ascending order and use distinctBy, then there will be a single contributor with an Answers value of 15:

topFolksClean
   .sortBy { AverageScore }
   .distinctBy { Answers }
   .sortBy { Answers }

Since you are sorting in ascending order the single contributor will have a score of 58.33. As you can see from the highlighted row this is the case.

On the other hand, if you sort in descending order then the contributor shown in the results should have a score of 909.07. Let’s confirm this:

topFolksClean
   .sortByDesc { AverageScore }
   .distinctBy { Answers }
   .sortBy { Answers }

Once again, you get the expected score. 

group


Now that you have a better understanding of the data, let’s go ahead and perform the grouping using groupBy. For simplicity, you will only group the top 10 results:

topFolksClean
   .sortBy { AverageScore }
   .tail(10)
   .groupBy { Answers }

The data returned by this result is a little more complex. You should see a column containing the keys for the groups, which in this case is the number of answers. Then you will have a column containing the data itself, as a nested dataframe.

This is how the result is represented in the notebook. Note that you can click on the groups to reveal their content:

If you have used the GROUP BY clause in a SQL SELECT statement, then this operation will be familiar to you. Here’s another example from PostgreSQL and DataGrip:

You can explore the grouped data gradually, starting by viewing the keys:

val groupedData = topFolksClean
   .sortBy { AverageScore }
   .tail(10)
   .groupBy { Answers }

groupedData.keys

Then, you can print the groups:

groupedData.groups

If you expand each group to view its contents, you can see that the groups for 14 and 15 answers have two members, and all the others have one. Hence, for the top 10 results, you have eight groups in total.

filter

Let’s see if you can use the core operations to find and display the groups with more than one result:

groupedData
   .groups
   .filter { df ->
       df.rowsCount() > 1
   }.forEach { df ->
       println(df.first().Answers)
   }

This code filters the groups, to find those with more than one row. Then it iterates through each group, printing the number of answers. Each row in an individual group will have the same number of answers, so you can pick any row you like. In this example, we chose the first.

The filter returns two numbers:

14

15

Because groups is returning a column of dataframes, the signatures of the filter and forEach methods are slightly different. Each time your lambda is invoked, there will be a single parameter, whose value is the current dataframe.

Altering the DataFrame schema

When working with dataframes, you are not limited to the schema that was inferred when the dataframe was created. You can add columns, remove columns, and even change the data type of existing columns. Consider the example below:

val ratedFolks = topFolksClean
   .sortBy { AverageScore }
   .remove("Answers")
   .add("Rating") {
       when (AverageScore) {
           in 0.0 ..< 100.0 -> "Low"
           in 100.0 ..< 300.0 -> "Medium"
           else -> "High"
       }
   }

Here you take the sorted data, remove the Answers column, and add a new Rating column, which is derived from the AverageScore. This gives us a new dataframe, which you refer to as ratedFolks.

As an example, you can then view the first and last three rows by concatenating them into a new dataframe:

val topAndBottom = listOf(ratedFolks.head(3), ratedFolks.tail(3)).concat()

topAndBottom

This is what should be displayed:

Note that this is achieved via an extension function, added to the standard Iterable type. Extensions are a key feature in Kotlin for making libraries simple and convenient to use.

Visualizing your data 

As you have already seen, you can take advantage of the Kandy library to plot the data. Let’s try to visualize which values of Answers occur most frequently in the data. 

Enter and run the following:

val answersPairedWithCounts = topFolksClean
   .groupBy { Answers }
   .count()
   .filter { column<Int>("count") >= 20 }

This code will group the records based on the number of answers and then replace each group with its size. For simplicity, let’s view only those groups with 20 or more members:

answersPairedWithCounts

Now, let’s ask Kandy to plot this dataframe as a bar chart:

answersPairedWithCounts.plot {
   bars {
       x(Answers)
       y(count)
   }
}

This is the resulting chart:

You can see that the most common number of questions answered was 11, occurring 63 times in the data.

Note that you already loaded the Kandy library in an earlier example:

%use kandy

If you skipped that example, then you will need to load the library now. As we mentioned earlier, it is best to do this in a separate cell.

Exporting your results

So far, you have only viewed your results and have not saved them. Let’s now take a look at how you can export data from Kotlin Notebook. In the two expressions below, you create a new dataframe and then export it as a CSV file and JSON document:

topFolksClean
   .sortBy { AverageScore }
   .tail(10)
   .toCsv()

topFolksClean
   .sortBy { AverageScore }
   .tail(10)
   .toJson()

Exporting a dataframe to HTML works the same way. The toStandaloneHTML method produces an HTML document containing a table, with associated CSS styles and JavaScript event handlers. This document can be opened directly in your default browser:

topFolksClean
   .sortBy { AverageScore }
   .tail(10)
   .toStandaloneHTML()
   .openInBrowser()

Conclusions

Hopefully, this tutorial has demonstrated the power and utility of the Kotlin DataFrame library. Please remember that the sample project contains data files and notebooks for all the tutorials in this series. You can clone this project and easily modify the examples, or replace the sample data files with your own.

In the next tutorial, we’ll show how to work with the Stack Exchange REST API to obtain JSON data. The information in this next installment will be both more complex and hierarchical, allowing you to see more of the power of the DataFrame API.

Continue ReadingA Step-by-Step Guide to Performing Data Analysis With Kotlin DataFrame

Data Analytics With Kotlin Notebooks, DataFrame, and Kandy

Interactively exploring and visualizing data allows users to uncover hidden patterns, trends, and relationships that may not be immediately apparent through static analysis. This instant feedback allows users to quickly validate their assumptions, identify outliers or anomalies, and adjust their analyses.

Kotlin Notebook is a convenient tool for exploring data in IntelliJ IDEA. It uses the Kotlin kernel to execute snippets of Kotlin code in cells and then renders the data in the editor. It integrates libraries such as Kotlin DataFrame for data processing and Kandy for chart creation, thus simplifying data analysis.

Recently, Roman and Anton explored the power of data analysis tools. A recording of their livestream is available below. In this blog post, we added the example from the session so that you can try the Kotlin Notebook plugin with the DataFrame and Kandy libraries at your convenience. 

You can explore the GitHub repository with the project we prepared for your convenience. The project includes the CSV file that was used during the livestream, so you can try reconstructing the same examples that were demonstrated.

Getting started with Kotlin Notebook

To get started with Kotlin notebooks, you simply need to go to the Settings | Plugins tab in IntelliJ IDEA Ultimate and install the plugin from JetBrains Marketplace. After installing the plugin, you’ll be ready to create your first notebook using the New | Kotlin Notebook action:

Once created, the notebook will contain one empty cell. Cells are the main components of notebooks, and they can contain either code or text. To run a code cell, click the Run button or use the Ctrl+Enter shortcut. The code will be executed, and any output or errors will be displayed below the cell. 

You can execute cells incrementally, meaning the calculations made by the previously executed cells are available without re-running. Check out this blog post for a quick introduction to the basics of Kotlin Notebook.

Read and explore data with DataFrame

Let’s now experiment with notebooks and see and see how we can use the DataFrame library to analyze data. The data source is this CSV file, which contains weather information collected in the Amsterdam area.

Drag and drop the CSV file from the Project view into a notebook cell. The notebook automatically generates the bootstrap code to add the DataFrame library as a dependency and read the CSV file.

The data comes in different formats, so you should adjust the parsing options to match your use case. For instance, you can specify the delimiter character or date format for parsing. Check the API documentation for more information. 

Column types are inferred from the CSV data by default. As a result, we can work with the data in a type-safe manner supported by the Kotlin compiler. After reading the data, you can inspect the inferred types simply by using the schema function on the DataFrame instance as follows:

It is also possible to get a quick statistical overview of the data using the describe function:

The describe function provides statistics about the data: the maximum and minimum values for numerical columns, counts of unique values and nulls, etc. These statistics can give hints for further exploration of the data.

The DataFrame API provides a wealth of options for manipulating data: selection, filtering, aggregation operations, etc.

The image below shows an example of filtering. The data has been filtered down to the year 2023, with only the ‘datetime’ column and all columns that contain the word “wind” in the title:

Say we want to explore the data to find the years with the statistically highest temperatures. Here are the steps we can take: First, sort the elements of the DataFrame instance in descending order by the `temp` attribute. Then, keep the first 30 elements of this sorted list. After that, any duplicate elements based on the ‘year’ attribute of ‘datetime’ should be removed. The resulting list will contain the distinct elements (in terms of the year) from the 30 elements with the highest temp values.

We needed to extract the ‘year’ from the ‘datetime’ column value. For this, we used the expr function, which creates a temporary expression column containing just the years. The expression was then provided as a parameter to the `distinct` function to get the final result.

Statistically, recent years have been warmer. However, it’s hard to recognize trends like this from the numbers alone. It is much easier to understand the data if we visualize it. For that, let’s use the Kandy library to create some graphs.

Visualize the data with Kandy

We recently introduced the Kandy library for plotting. Kandy can be used as a standalone library to produce graphs, but it is also conveniently integrated with Kotlin Notebook. The library provides a simple DSL to produce graphs of various kinds. The rich examples gallery demonstrates various diagrams that can be generated with Kandy. 

To start using Kandy with Kotlin Notebook, add the ‘%use kandy‘ line into a cell and execute it. This will automatically load the latest stable version of Kandy, add all necessary imports, and add plot rendering.

For DataFrame, Kandy provides the ‘plot‘ extension function to visualize data. This will help us to plot the graphs in our example quickly. 

For instance, let’s plot the temperature values by date. For that, we only need to choose the graph type, ‘line’, and map the values: temperature values are mapped to the y-axis, and years will appear on the x-axis. Additionally, we can choose to change the color of the plot line depending on the humidity – this will give insight into the correlation between temperature and humidity. Looking at the result, we can conclude that the lower the temperature, the more humid it is.

Summary

Kotlin notebooks are interactive worksheets with a wide variety of outputs that allow you to explore and experiment with your Kotlin code without additional environment setup. 

With the help of integrated libraries, such as Kotlin DataFrame and Kandy, you can explore, visualize, find patterns, and learn interesting facts about your data.  You can get started with Kotlin Notebook quickly by exploring the repository with examples presented in the article.

To learn more about Kotlin for data science, check the entry page in the documentation and join #datascience channel in Kotlin Slack.

Continue ReadingData Analytics With Kotlin Notebooks, DataFrame, and Kandy

Kandy: the new Kotlin plotting library by JetBrains

We are excited to introduce Kandy, a new Kotlin plotting library by JetBrains. It provides a new, powerful DSL for creating charts of various kinds. The first public preview version is ready for you to try, and we welcome any feedback and comments you may have.

Kandy Documentation

How does it look and feel?

df.plot {
   points {
       x(xShot) { axis.name = "Horizontal Position (meters)" }
       y(yShot) { axis.name = "Vertical Position (meters)" }
       size = 8.5
       color(outcome) {
           scale = categorical(
               true to Color.GREEN, false to Color.RED
           )
           legend {
               name = "Outcome"
               breaksLabeled(true to "Goal", false to "Miss")
           }
       }
   }
   layout.title = "Penalty Shot Outcomes Analysis"
}

Why Kandy?

Our Kotlin for Data Analytics ecosystem is growing rapidly. However, until now, an important piece of the puzzle was missing: a plotting tool. That’s why we decided to create Kandy, a simple, idiomatic, readable, typesafe DSL for plotting, deeply integrated with our other tools – Kotlin DataFrame and Kotlin Notebook.

In Kotlin Notebook

To start using Kandy in your notebook, just use the %use kandy line, which will automatically load the latest stable version of Kandy, add all necessary imports, and add plot rendering. Charts are rendered directly in the notebook cell outputs using Swing, and they are interactive – you can hover over a plot element to see tooltips. Plots are displayed with an automatic theme. They can also be saved in one of the available formats from outputs (via the output menu).

With Kotlin DataFrame

Kandy provides a direct continuation of the DataFrame workflow, adding the .plot {} extension for DataFrame, a quick and easy way to visualize your data. Moreover, when working in Kotlin Notebook or with the DataFrame plugin in IntelliJ IDEA, you can use auto-generated DataFrame extension property columns, making plotting even more typesafe and protecting against misspelled column names.

What kind of charts does Kandy support?

Kandy provides a wide range of charts, including the most popular ones:

And that’s not all of it! You can see Kandy plot in our gallery of examples.

How to get started

Can’t wait to try Kandy? Here are links to the quickstart and examples: 

Documentation

GitHub repository

Have you found a bug? Or maybe you didn’t find the kind of chart or the feature you wanted, or you have another problem or suggestion. Feel free to visit our GitHub issues page to let us know what we can improve.

We also invite you to join the #datascience channel in the Kotlin Slack (get an invite here). In this channel, you can ask questions, participate in discussions, and get notifications about the new releases.

Let’s Kotlin and #use_kandy!

Continue ReadingKandy: the new Kotlin plotting library by JetBrains

Kotlin for WebAssembly Goes Alpha

Kotlin/Wasm, the newest Kotlin Multiplatform target platform, has reached Alpha status! Here’s what you need to know about this change at a glance:

  • JetBrains has promoted Kotlin/Wasm to Alpha, making it ready for you to try for yourself. Your feedback will help shape the future of building web applications with Kotlin!
  • As an Alpha release, Kotlin/Wasm is ready for you to use in pre-production scenarios, but it still has many areas that are works in progress. We rely on the community to help inform and prioritize the decisions influencing Kotlin/Wasm.
  • Compose for Web (currently experimental) is powered by Kotlin/Wasm. Together, the two technologies allow you to create declarative user interfaces for web applications in 100% Kotlin.

Get started with Kotlin/Wasm

WebAssembly: The newest Kotlin Multiplatform target

WebAssembly is establishing itself as the standard compilation target for languages targeting the browser – and beyond! With Kotlin/Wasm, we’re giving you the ability to make use of this new target via Kotlin Multiplatform. We first introduced Kotlin/Wasm in Kotlin 1.8.20 as an experimental technology, and have since improved and refined it.

Because Kotlin is an automatically memory-managed language, it builds on the garbage collection proposal, which recently reached phase 4 (standardization). That means it is now enabled by default in a number of major browsers. For example, recent versions of both Chrome and Firefox can run Kotlin/Wasm applications without any required adjustments. While Safari currently doesn’t support Wasm GC yet, implementation of the required functionality in JavaScriptCore is already underway.

Getting started with Kotlin/Wasm

Join the Kotlin/Wasm community

An easy way to get started with Kotlin/Wasm is to take a look at the Getting Started page. Here, you’ll find an overview of the technology and instructions on how to set up your own Kotlin/Wasm application. You’ll also see projects and links to example projects that show off different facets of Kotlin/Wasm, including those that illustrate how to use it in the browser, together with Compose Multiplatform, and more.

Kotlin/Wasm goes Alpha: explore the technology in detail and see example projects

The Kotlin Playground now also has support for Kotlin/Wasm, meaning you can write your first WebAssembly code snippets right in your browser, and explore what Kotlin/Wasm has to offer.

To help you go beyond your first “Hello World” examples with WebAssembly, we are also bringing the `kotlinx` suite of libraries to Kotlin/Wasm. This includes kotlinx-atomicfu, kotlinx.coroutines, kotlinx.serialization, kotlinx-datetime, and kotlinx-io.

Ktor, the JetBrains framework for building networked applications, is also coming to WebAssembly. With the next release, you’ll be able to use Ktor’s HTTP clients to make network requests right from your Kotlin/Wasm code.

Compose Multiplatform: Powered by Kotlin/Wasm

Kotlin/Wasm isn’t bound to any specific UI framework. It’s a general way of running your Kotlin code in the browser. However, it is the underlying technology for the experimental web target of Compose Multiplatform, the declarative multiplatform UI toolkit by JetBrains based on Google’s Jetpack Compose. Compose Multiplatform for Web uses canvas-based rendering, meaning that you can use the same layouts and components as you would on other platforms. Out of the box, it comes with the Material and Material 3 design components.

With Compose Multiplatform, you can build shared applications that target the most important platforms: Android and iOS, desktop, and – thanks to the power of Kotlin/Wasm – the browser. To start building your own shared UIs, you can generate a project using the Kotlin Multiplatform Web Wizard, which now also experimentally supports the Kotlin/Wasm target.

Performance

WebAssembly is designed from the ground up as a compilation target for languages, meaning the Kotlin compiler can convert your source code into performant WebAssembly bytecode. We regularly run benchmarks on Kotlin/Wasm to ensure its runtime performance. Since Kotlin/Wasm is still in Alpha, the team continues to work on performance improvements, but as you can see, Kotlin/Wasm already outperforms Kotlin/JS in almost all of our macro benchmarks:

Likewise, Compose Multiplatform running on Kotlin/Wasm already shows promising performance characteristics, with execution speed comparable to that of running the same application on the JVM:

AnimatedVisibility: Wasm takes a factor of 0.5 of the time of a JS implementation
LazyGrid: Wasm takes a factor of 0.5 of the time of a JS implementation
VisualEffects: Wasm takes a factor of 0.5 of the time of a JS implementation

These benchmark results come from our testing in a recent version of Google Chrome, but we observed similar results in other browsers we tested.

What’s in the works

As a technology in Alpha, Kotlin/Wasm is evolving rapidly, and the team is busy making improvements and enhancements. As such, there are still a number of areas that are works in progress.

Currently, the debugging support in Kotlin/Wasm is limited, and we’re working on improving its capabilities going forward. We’re also aware that bundle size is an important factor when it comes to targeting the web, and we want to further optimize the outputs generated by the compiler, especially for Compose Multiplatform projects.

As WebAssembly continues evolving, we want to take advantage of new proposals as they arrive – whether that’s stack switching, threading, or others. We’re also working on introducing support for the WebAssembly Component Model to Kotlin, which will enable you to build interoperable Wasm libraries and applications. We’re also still in the process of making Kotlin/Wasm an awesome target for development outside of the browser, including support for WASI, the WebAssembly System Interface. As a part of the WebAssembly Community Group, and by actively collaborating with vendors of WebAssembly VMs, we’re striving to ensure that Kotlin/Wasm provides a great experience no matter where you’re running it.

Our goal is to provide an excellent developer experience for you, and make sure that it meets your requirements in terms of performance and bundle size. As we make progress on these fronts, we’ll make sure to provide you with updates and share more information!

Join the community to get updates and share your feedback!

Join the Kotlin/Wasm community

If you want to connect with the team and other developers excited about Kotlin/Wasm, we invite you to join the discussion on the Kotlin Slack (get your invite here). In the #webassembly channel, you can find discussions about everything Kotlin and WebAssembly.

Kotlin/Wasm is in Alpha, and we want to make sure we continue evolving the technology based on your requirements. Help us help you by reporting problems, telling us about APIs that you feel are missing, and requesting features you’d like to see. You can do so by adding issues to the Kotlin YouTrack project.

We’re excited to take this next step with Kotlin and look forward to seeing what you’ll create with Kotlin/Wasm!

See Kotlin/Wasm in action!

On Tuesday, December 12, 2023, Kotlin/Wasm Team Lead Zalim Bashorov will present a live session entitled Kotlin and WebAssembly: Unleashing Cross-Platform Power on the official Kotlin YouTube channel! To make sure you don’t miss it, sign up to receive notifications.

See also

Continue ReadingKotlin for WebAssembly Goes Alpha

Kotlin Support in Fleet: Explore a New IDE from JetBrains

JetBrains Fleet is a lightweight code editor and IDE that uses the IntelliJ code-processing engine. The product is now in public preview, so everyone can try it.

Currently, Fleet allows you to develop in Python, TypeScript / JavaScript, Go, Java, PHP, C#, and other popular languages such as Kotlin. Kotlin support is one of the most advanced, since Fleet is developed mostly in Kotlin and the JetBrains team also uses Fleet to develop Fleet. You can refer to the complete Fleet feature matrix that describes which languages and technologies the product already supports and which are still in the works. With plugins to come soon, more languages and technologies will be supported in the near future in Fleet.

In this blog post, we’d like to tell you more about the current state of Kotlin support in the Fleet Public Preview, including an overview of the different capabilities of the IDE for Kotlin projects.

Explore more

Why Fleet?

Fleet has been built from the ground up based on our many years of experience in IDE development. It combines the simplicity and speed of a lightweight text editor with the transformative power of an intelligent development environment.

Fleet is not designed to replace or replicate JetBrains’ existing IDEs. The main idea behind Fleet is to give developers a new experience with a smart, polyglot tool and workflows such as distributed and collaborative development and the use of generative AI for coding. JetBrains is working on Fleet while continuing to develop its existing IDEs.

Available features for Kotlin in Fleet Smart Mode

Kotlin is supported out of the box in Fleet, making working with the language not only productive and simple, but also enjoyable. It provides a streamlined experience for Kotlin developers. When you want to quickly dive into your project, analyze its structure, and make targeted edits in no time, you can use Fleet as an editor. But when need arises for more robust functionalities, it can transform into a full-fledged IDE.

If you want to enable code intelligence features in Kotlin, you should turn on Smart Mode. These additional features help you avoid mistakes while writing your code faster and more productively.

Enabling Smart Mode in Fleet

Once Smart Mode is enabled, you get access to the code editing features that IntelliJ IDEA users know and love, including:

  • Code completion
  • Code actions
  • Type and parameter information
  • Live templates
  • Code generation

Let’s take a closer look at these features and how they can streamline your coding routine.

Code completion

While you are typing, Fleet provides suggestions for completing your code based on various factors like available code intelligence services, the project structure, surrounding code, and symbol visibility.
The completion suggestions appear either automatically or when you manually activate them by pressing Ctrl+Space.

Code completion for Kotlin in JetBrains Fleet

Code actions

Thanks to continuous code quality analysis, you can make informed decisions and enhance the efficiency of your coding process. Fleet suggests actions tailored to the specific context you’re working in. These suggestions encompass actions ranging from correcting errors to refactoring the code at the caret.

Code actions for Kotlin in Fleet

You can check which actions are available at the caret by pressing Opt+Enter (on macOS) or Alt+Enter (on Windows and Linux).

Once you have decided which action to use, you can either apply it right away or preview the result with a shortcut: Cmd+P on macOS, Ctrl+P on Windows and Linux.

Code actions for Kotlin in Fleet

Type info

If you are not sure what type you are currently dealing with, you can easily find out by pressing Cmd+Shift+T (on macOS) or Ctrl+Shift+T (on Windows and Linux). 

This will prompt Fleet to show you the details about the static type of the symbol or expression.

Type info for Kotlin in JetBrains Fleet

Parameter info

Are you using a method that has numerous overloads, or do you need to quickly find the necessary parameters? Navigate through the available options simply by pressing Cmd+I (on macOS) or Ctrl+I (on Windows and Linux).

Parameter info for Kotlin in JetBrains Fleet

Live templates

Fleet provides a set of Kotlin live templates you can use to insert common constructs into your code, such as loops, conditions, declarations, or print statements. Unlike IntelliJ IDEA, Fleet doesn’t allow you to create new templates. However, you can use the many pre-made templates with your Kotlin code. Check out the complete list of live templates in the Fleet documentation.

Live templates for Kotlin in Fleet

Code generation

When you start typing a particular method or statement, Fleet suggests possible completion options based on the context and existing code. Simply select a suggestion to instantly generate the required code. You can take advantage of code completion to override superclass members like equals(), hashcode(), and other methods.

Code generation for Kotlin in Fleet

By using code generation, you can save time and make sure that your code follows the correct syntax and structure, as Fleet helps you generate the necessary code snippets.

Give Fleet a try and share your experience

Fleet is a polyglot code editor and IDE that supports Kotlin among many other languages. You can think of Fleet as a multipurpose tool and expect dedicated support for specific types of projects to come later.

If you are curious and see a use for a good new tool in your arsenal, we invite you to try Fleet for yourself and explore its capabilities!

The easiest way to download and get started with Fleet is by using the free JetBrains Toolbox App.

Try Fleet Preview

You can also watch this short Fleet overview video, which will help you get started, as well as turn to the documentation for further guidance.

Fleet is still in the Preview stage and is being actively developed. Your feedback and thoughts on the product will help the JetBrains team stabilize and improve it. If you encounter any issues, please submit reports to this issue tracker. You can also get in touch with us at fleet-support@jetbrains.com or @jetbrains_fleet.

Stay tuned for upcoming announcements!

What else to read and watch:

Getting started with Kotlin

JetBrains Fleet — Public Preview Launch Demo [Video]

Fleet 1.19, AI-powered Features and Easier Configuration for rust-analyzer, Python Interpreters, and npm

Continue ReadingKotlin Support in Fleet: Explore a New IDE from JetBrains

End of content

No more pages to load