
Data Analytics With Kotlin Notebooks, DataFrame, and Kandy
Interactively exploring and visualizing data allows users to uncover hidden patterns, trends, and relationships that may not be immediately apparent through static analysis. This instant feedback allows users to quickly validate their assumptions, identify outliers or anomalies, and adjust their analyses.
Kotlin Notebook is a convenient tool for exploring data in IntelliJ IDEA. It uses the Kotlin kernel to execute snippets of Kotlin code in cells and then renders the data in the editor. It integrates libraries such as Kotlin DataFrame for data processing and Kandy for chart creation, thus simplifying data analysis.
Recently, Roman and Anton explored the power of data analysis tools. A recording of their livestream is available below. In this blog post, we added the example from the session so that you can try the Kotlin Notebook plugin with the DataFrame and Kandy libraries at your convenience.
You can explore the GitHub repository with the project we prepared for your convenience. The project includes the CSV file that was used during the livestream, so you can try reconstructing the same examples that were demonstrated.
Getting started with Kotlin Notebook
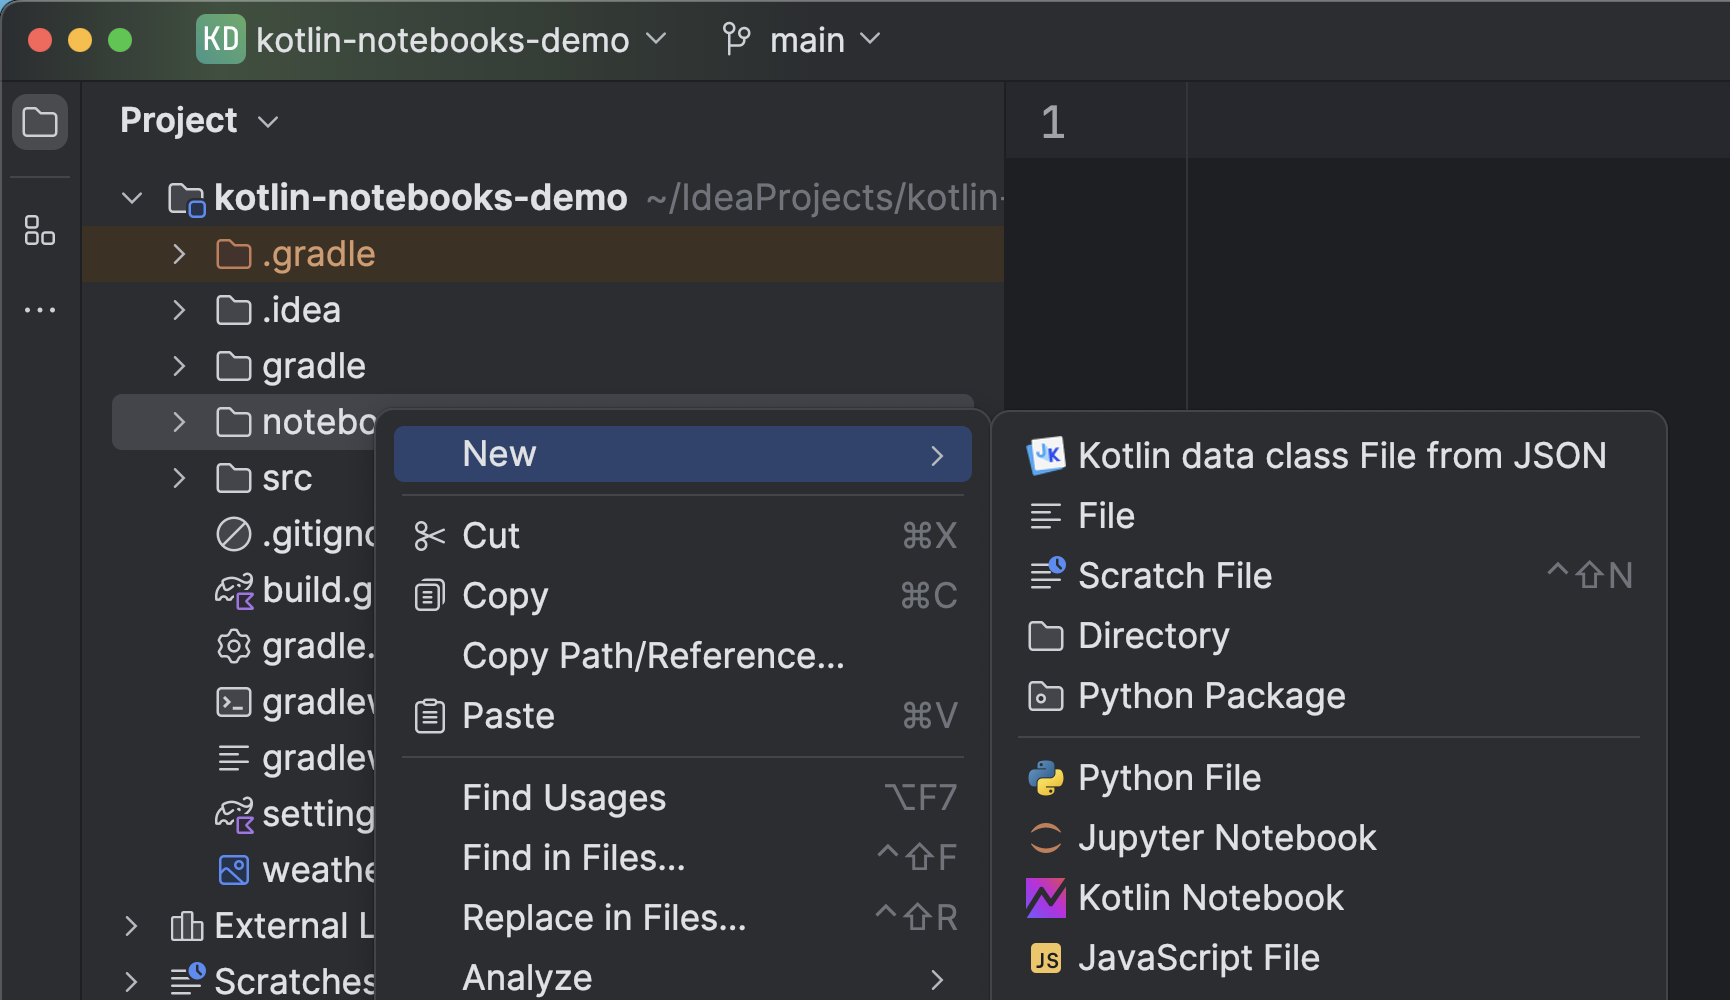
To get started with Kotlin notebooks, you simply need to go to the Settings | Plugins tab in IntelliJ IDEA Ultimate and install the plugin from JetBrains Marketplace. After installing the plugin, you’ll be ready to create your first notebook using the New | Kotlin Notebook action:
Once created, the notebook will contain one empty cell. Cells are the main components of notebooks, and they can contain either code or text. To run a code cell, click the Run button or use the Ctrl+Enter shortcut. The code will be executed, and any output or errors will be displayed below the cell.
You can execute cells incrementally, meaning the calculations made by the previously executed cells are available without re-running. Check out this blog post for a quick introduction to the basics of Kotlin Notebook.
Read and explore data with DataFrame
Let’s now experiment with notebooks and see and see how we can use the DataFrame library to analyze data. The data source is this CSV file, which contains weather information collected in the Amsterdam area.
Drag and drop the CSV file from the Project view into a notebook cell. The notebook automatically generates the bootstrap code to add the DataFrame library as a dependency and read the CSV file.

The data comes in different formats, so you should adjust the parsing options to match your use case. For instance, you can specify the delimiter character or date format for parsing. Check the API documentation for more information.
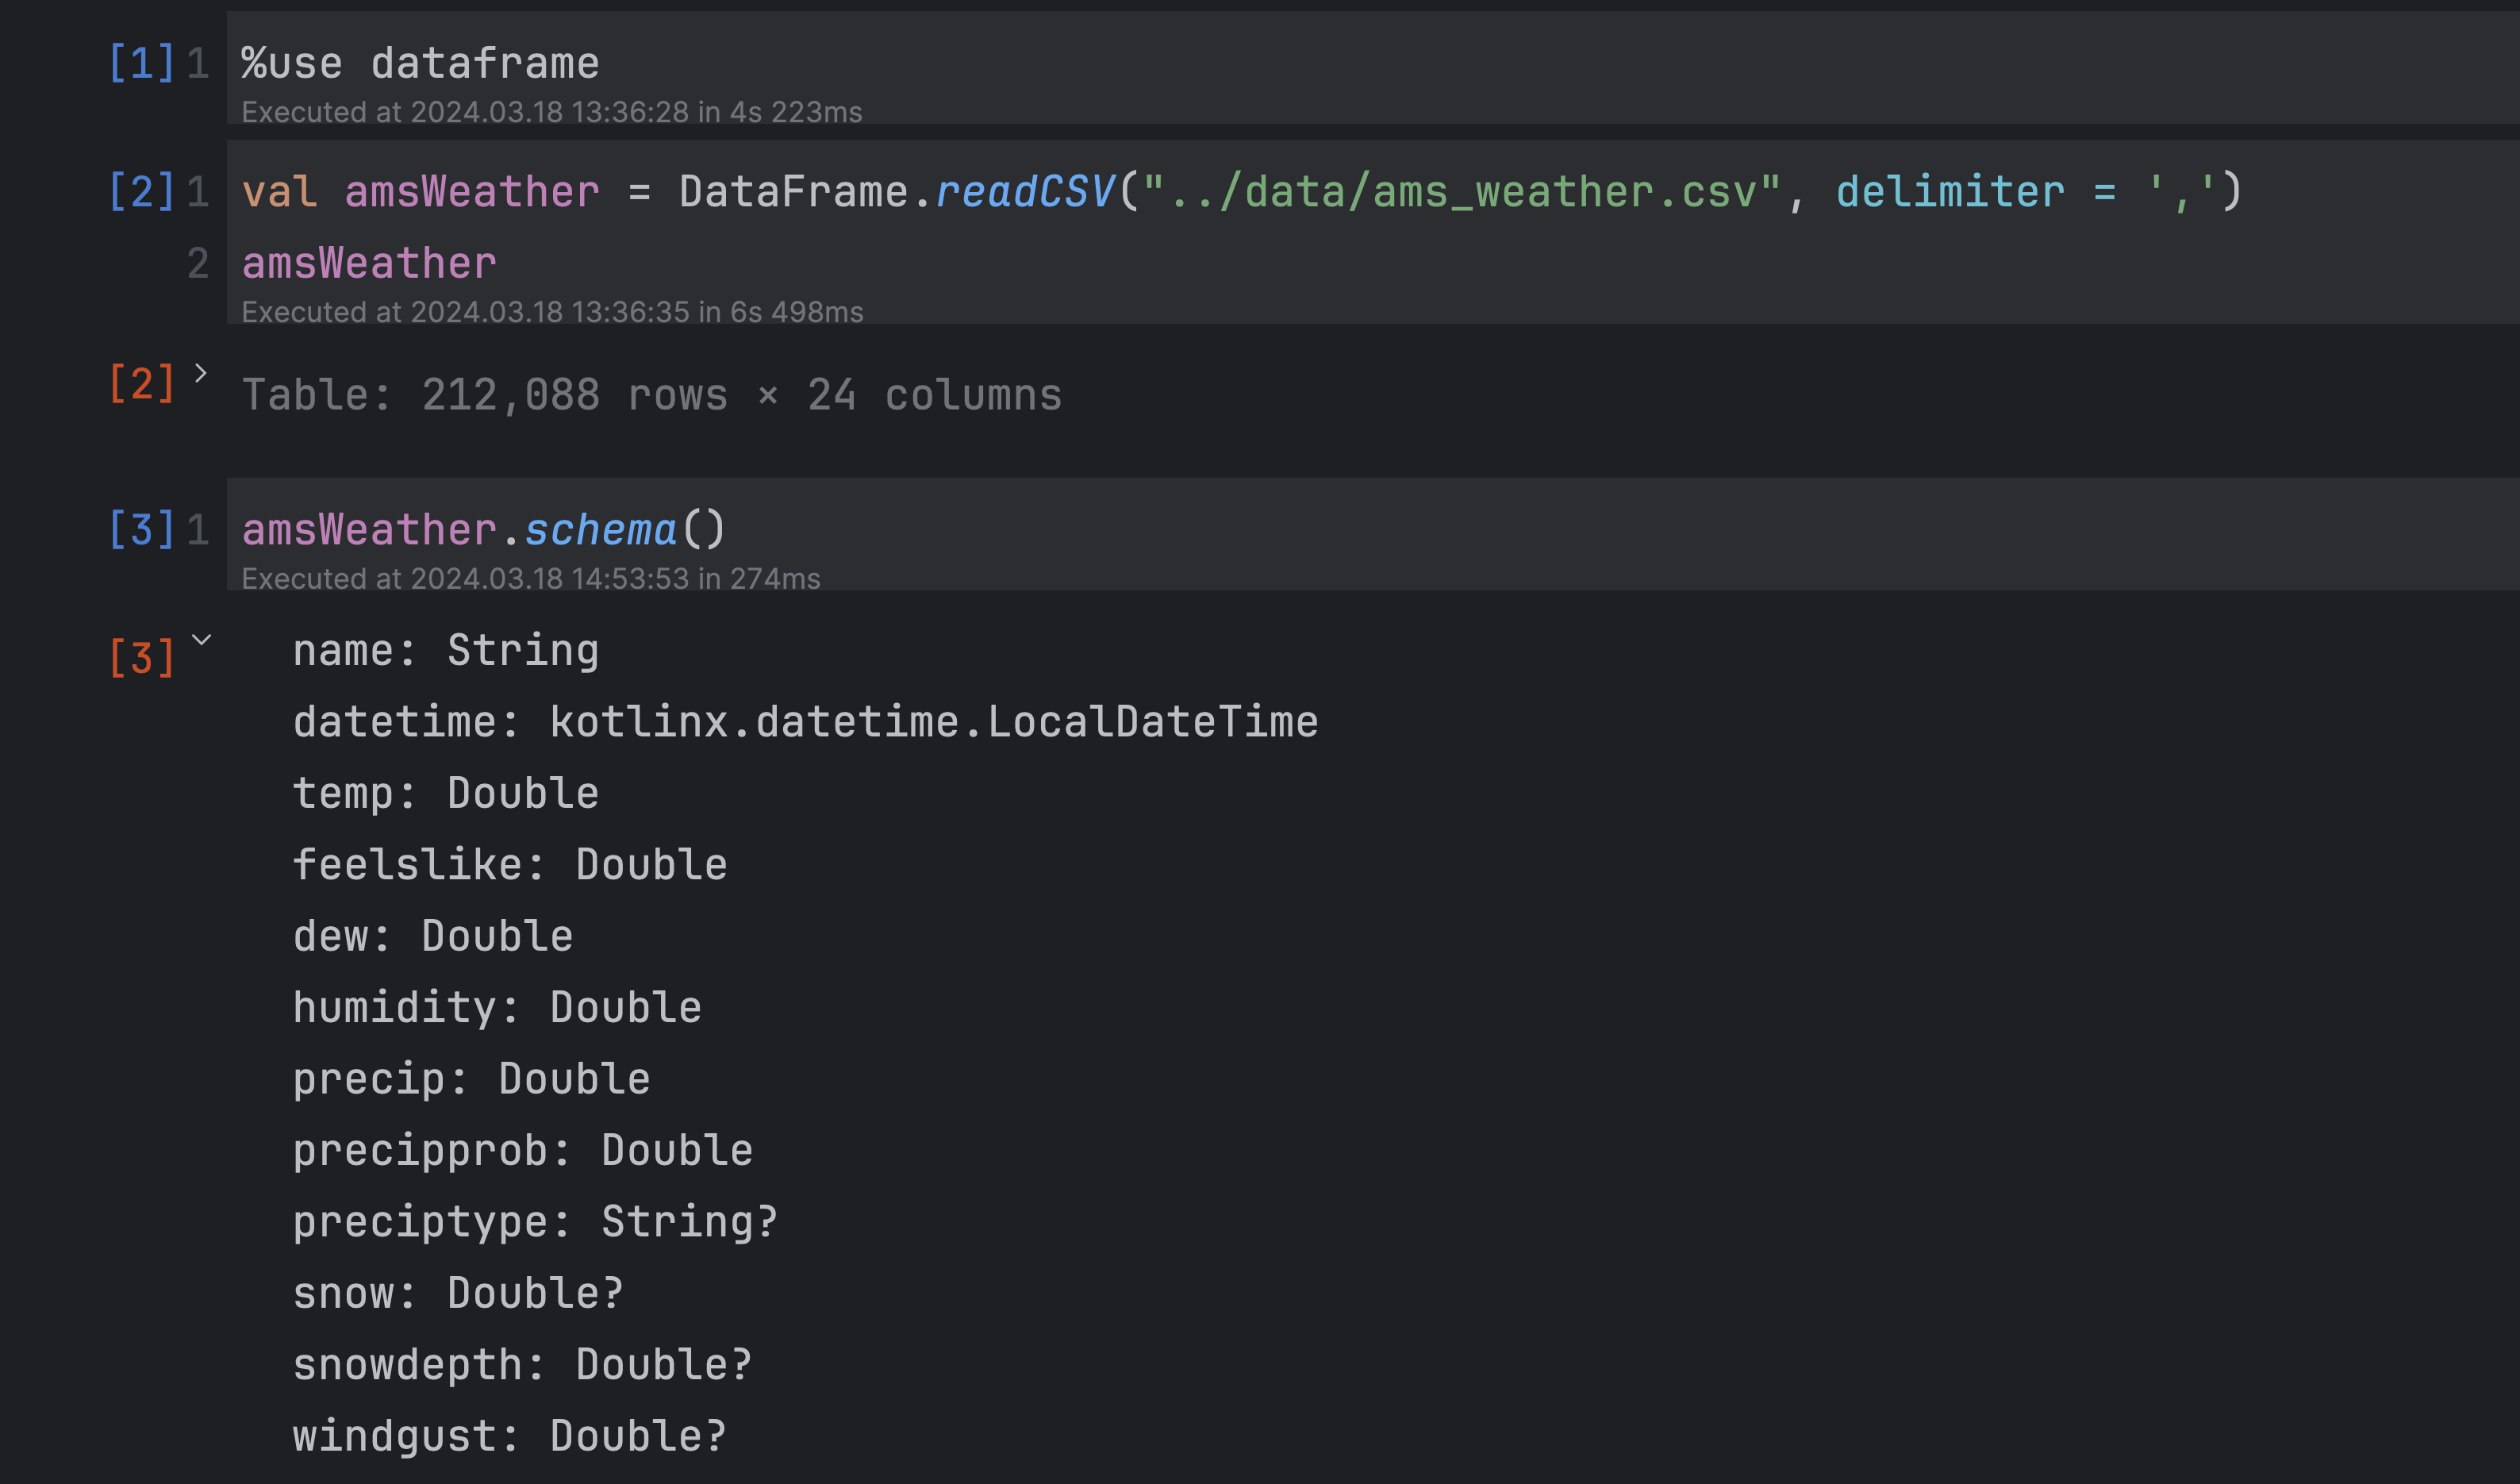
Column types are inferred from the CSV data by default. As a result, we can work with the data in a type-safe manner supported by the Kotlin compiler. After reading the data, you can inspect the inferred types simply by using the schema function on the DataFrame instance as follows:
It is also possible to get a quick statistical overview of the data using the describe function:
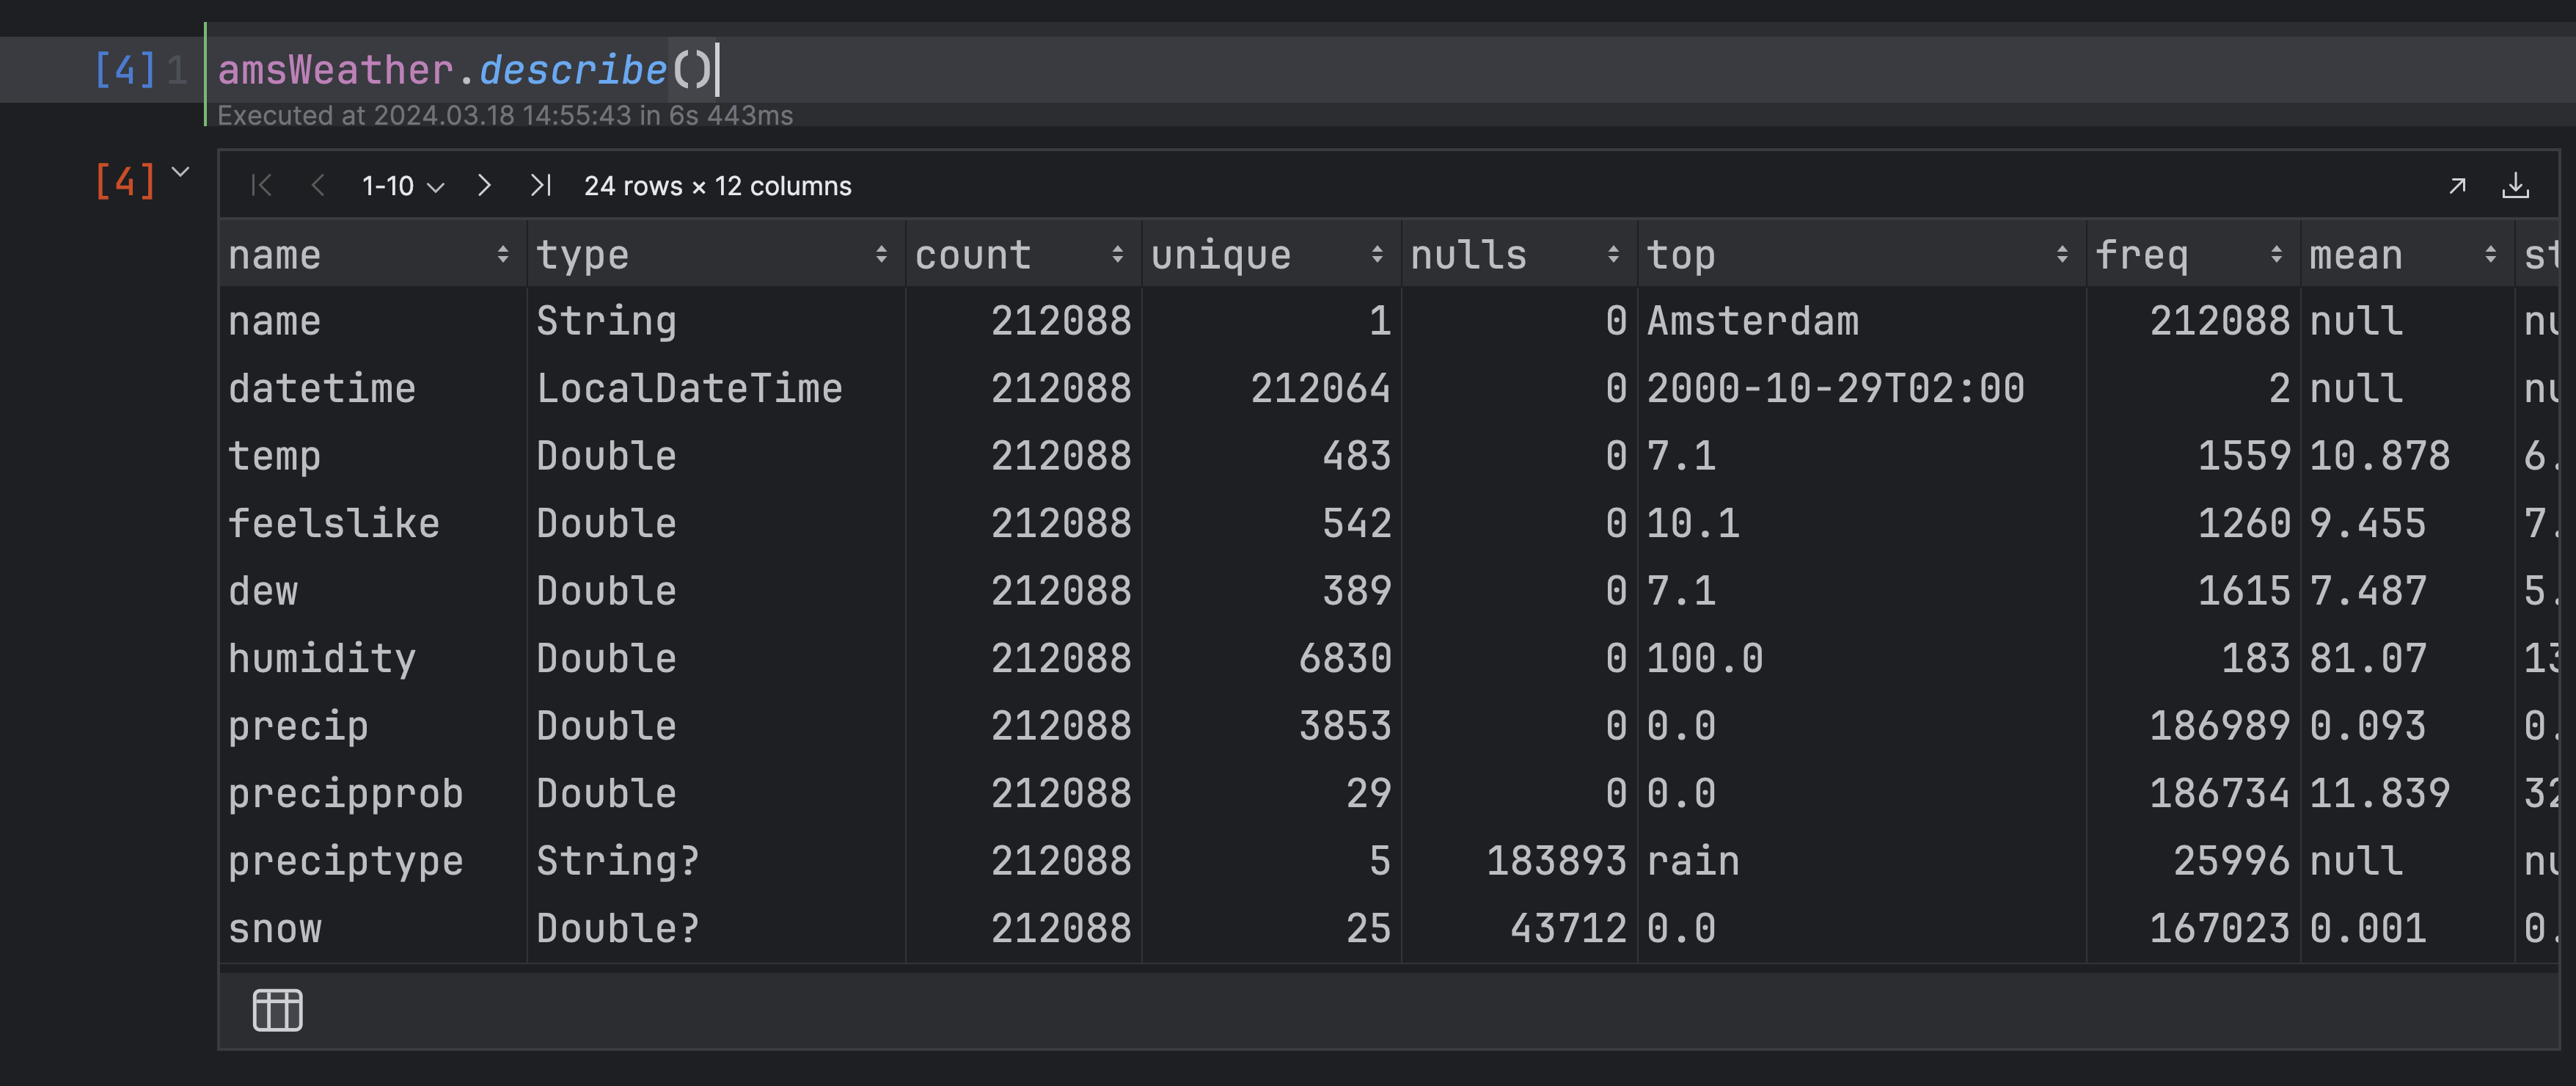
The describe function provides statistics about the data: the maximum and minimum values for numerical columns, counts of unique values and nulls, etc. These statistics can give hints for further exploration of the data.
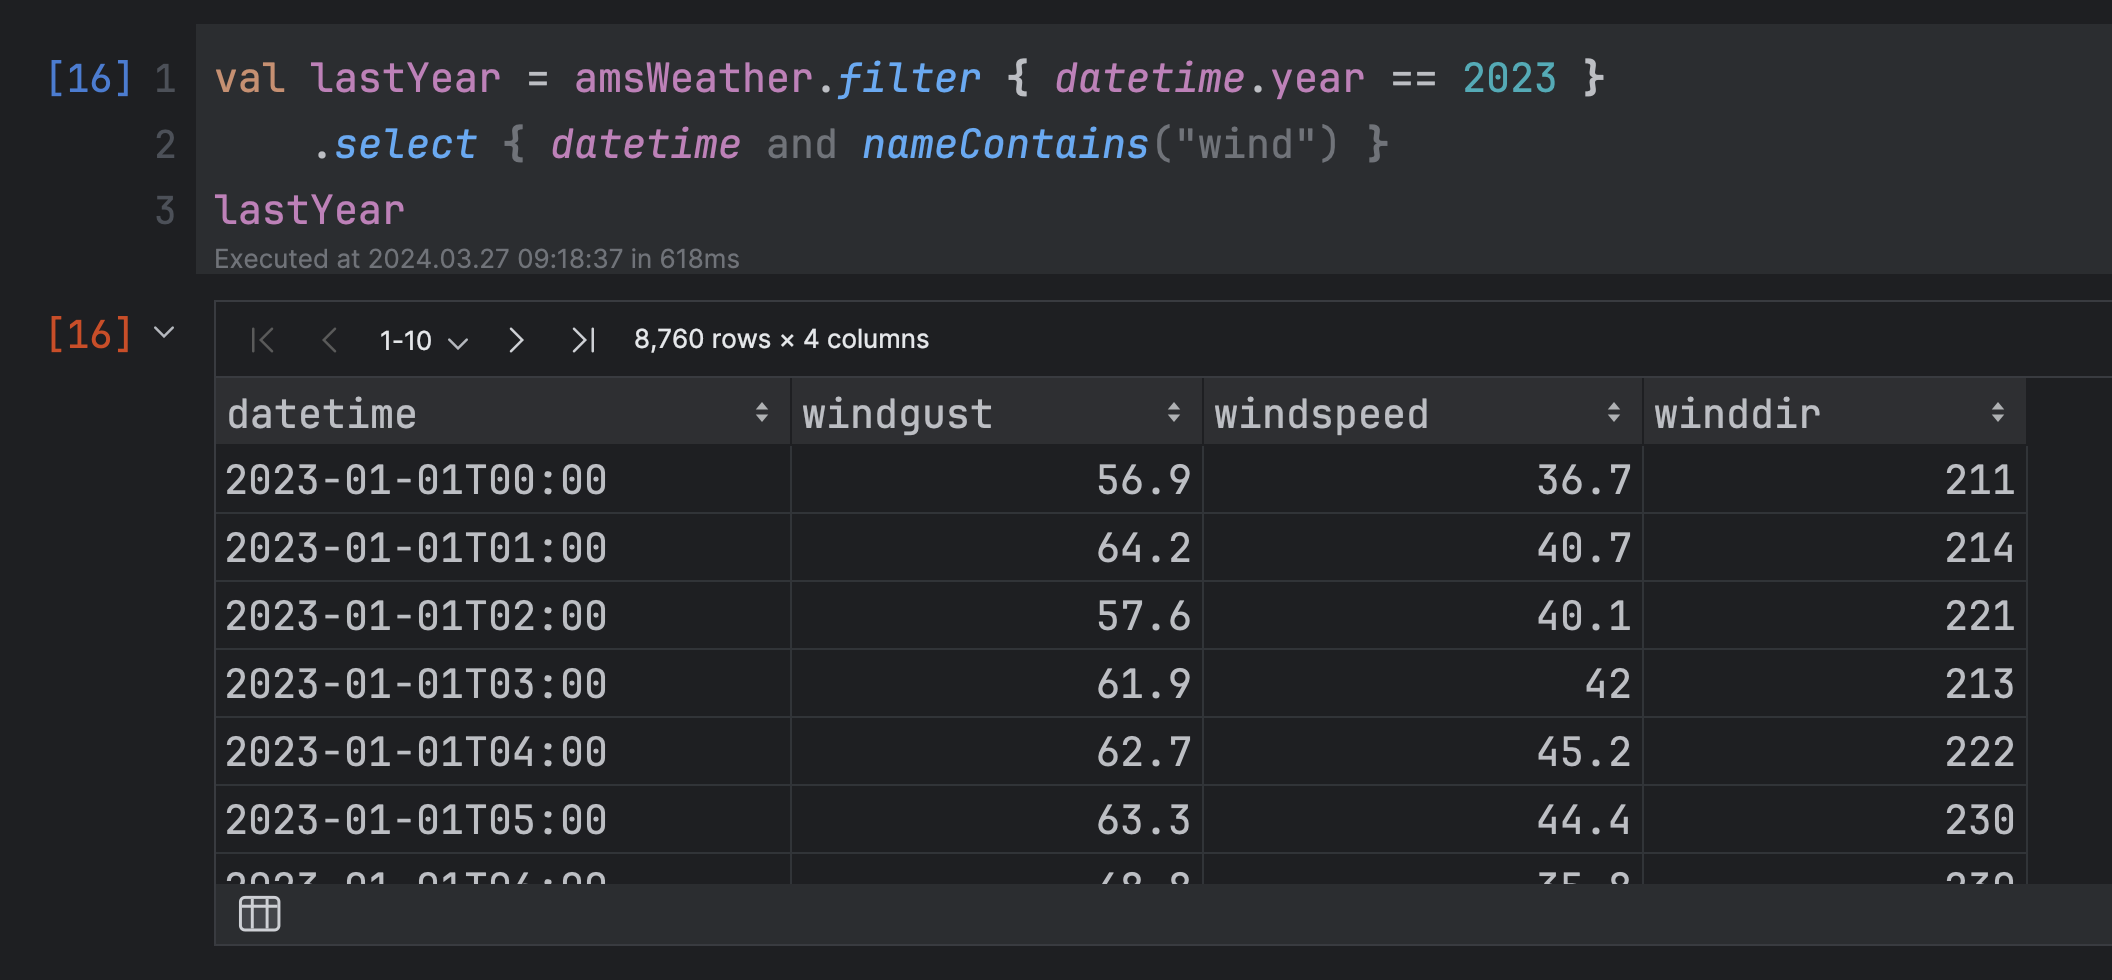
The DataFrame API provides a wealth of options for manipulating data: selection, filtering, aggregation operations, etc.
The image below shows an example of filtering. The data has been filtered down to the year 2023, with only the ‘datetime’ column and all columns that contain the word “wind” in the title:
Say we want to explore the data to find the years with the statistically highest temperatures. Here are the steps we can take: First, sort the elements of the DataFrame instance in descending order by the `temp` attribute. Then, keep the first 30 elements of this sorted list. After that, any duplicate elements based on the ‘year’ attribute of ‘datetime’ should be removed. The resulting list will contain the distinct elements (in terms of the year) from the 30 elements with the highest temp values.

We needed to extract the ‘year’ from the ‘datetime’ column value. For this, we used the expr function, which creates a temporary expression column containing just the years. The expression was then provided as a parameter to the `distinct` function to get the final result.
Statistically, recent years have been warmer. However, it’s hard to recognize trends like this from the numbers alone. It is much easier to understand the data if we visualize it. For that, let’s use the Kandy library to create some graphs.
Visualize the data with Kandy
We recently introduced the Kandy library for plotting. Kandy can be used as a standalone library to produce graphs, but it is also conveniently integrated with Kotlin Notebook. The library provides a simple DSL to produce graphs of various kinds. The rich examples gallery demonstrates various diagrams that can be generated with Kandy.
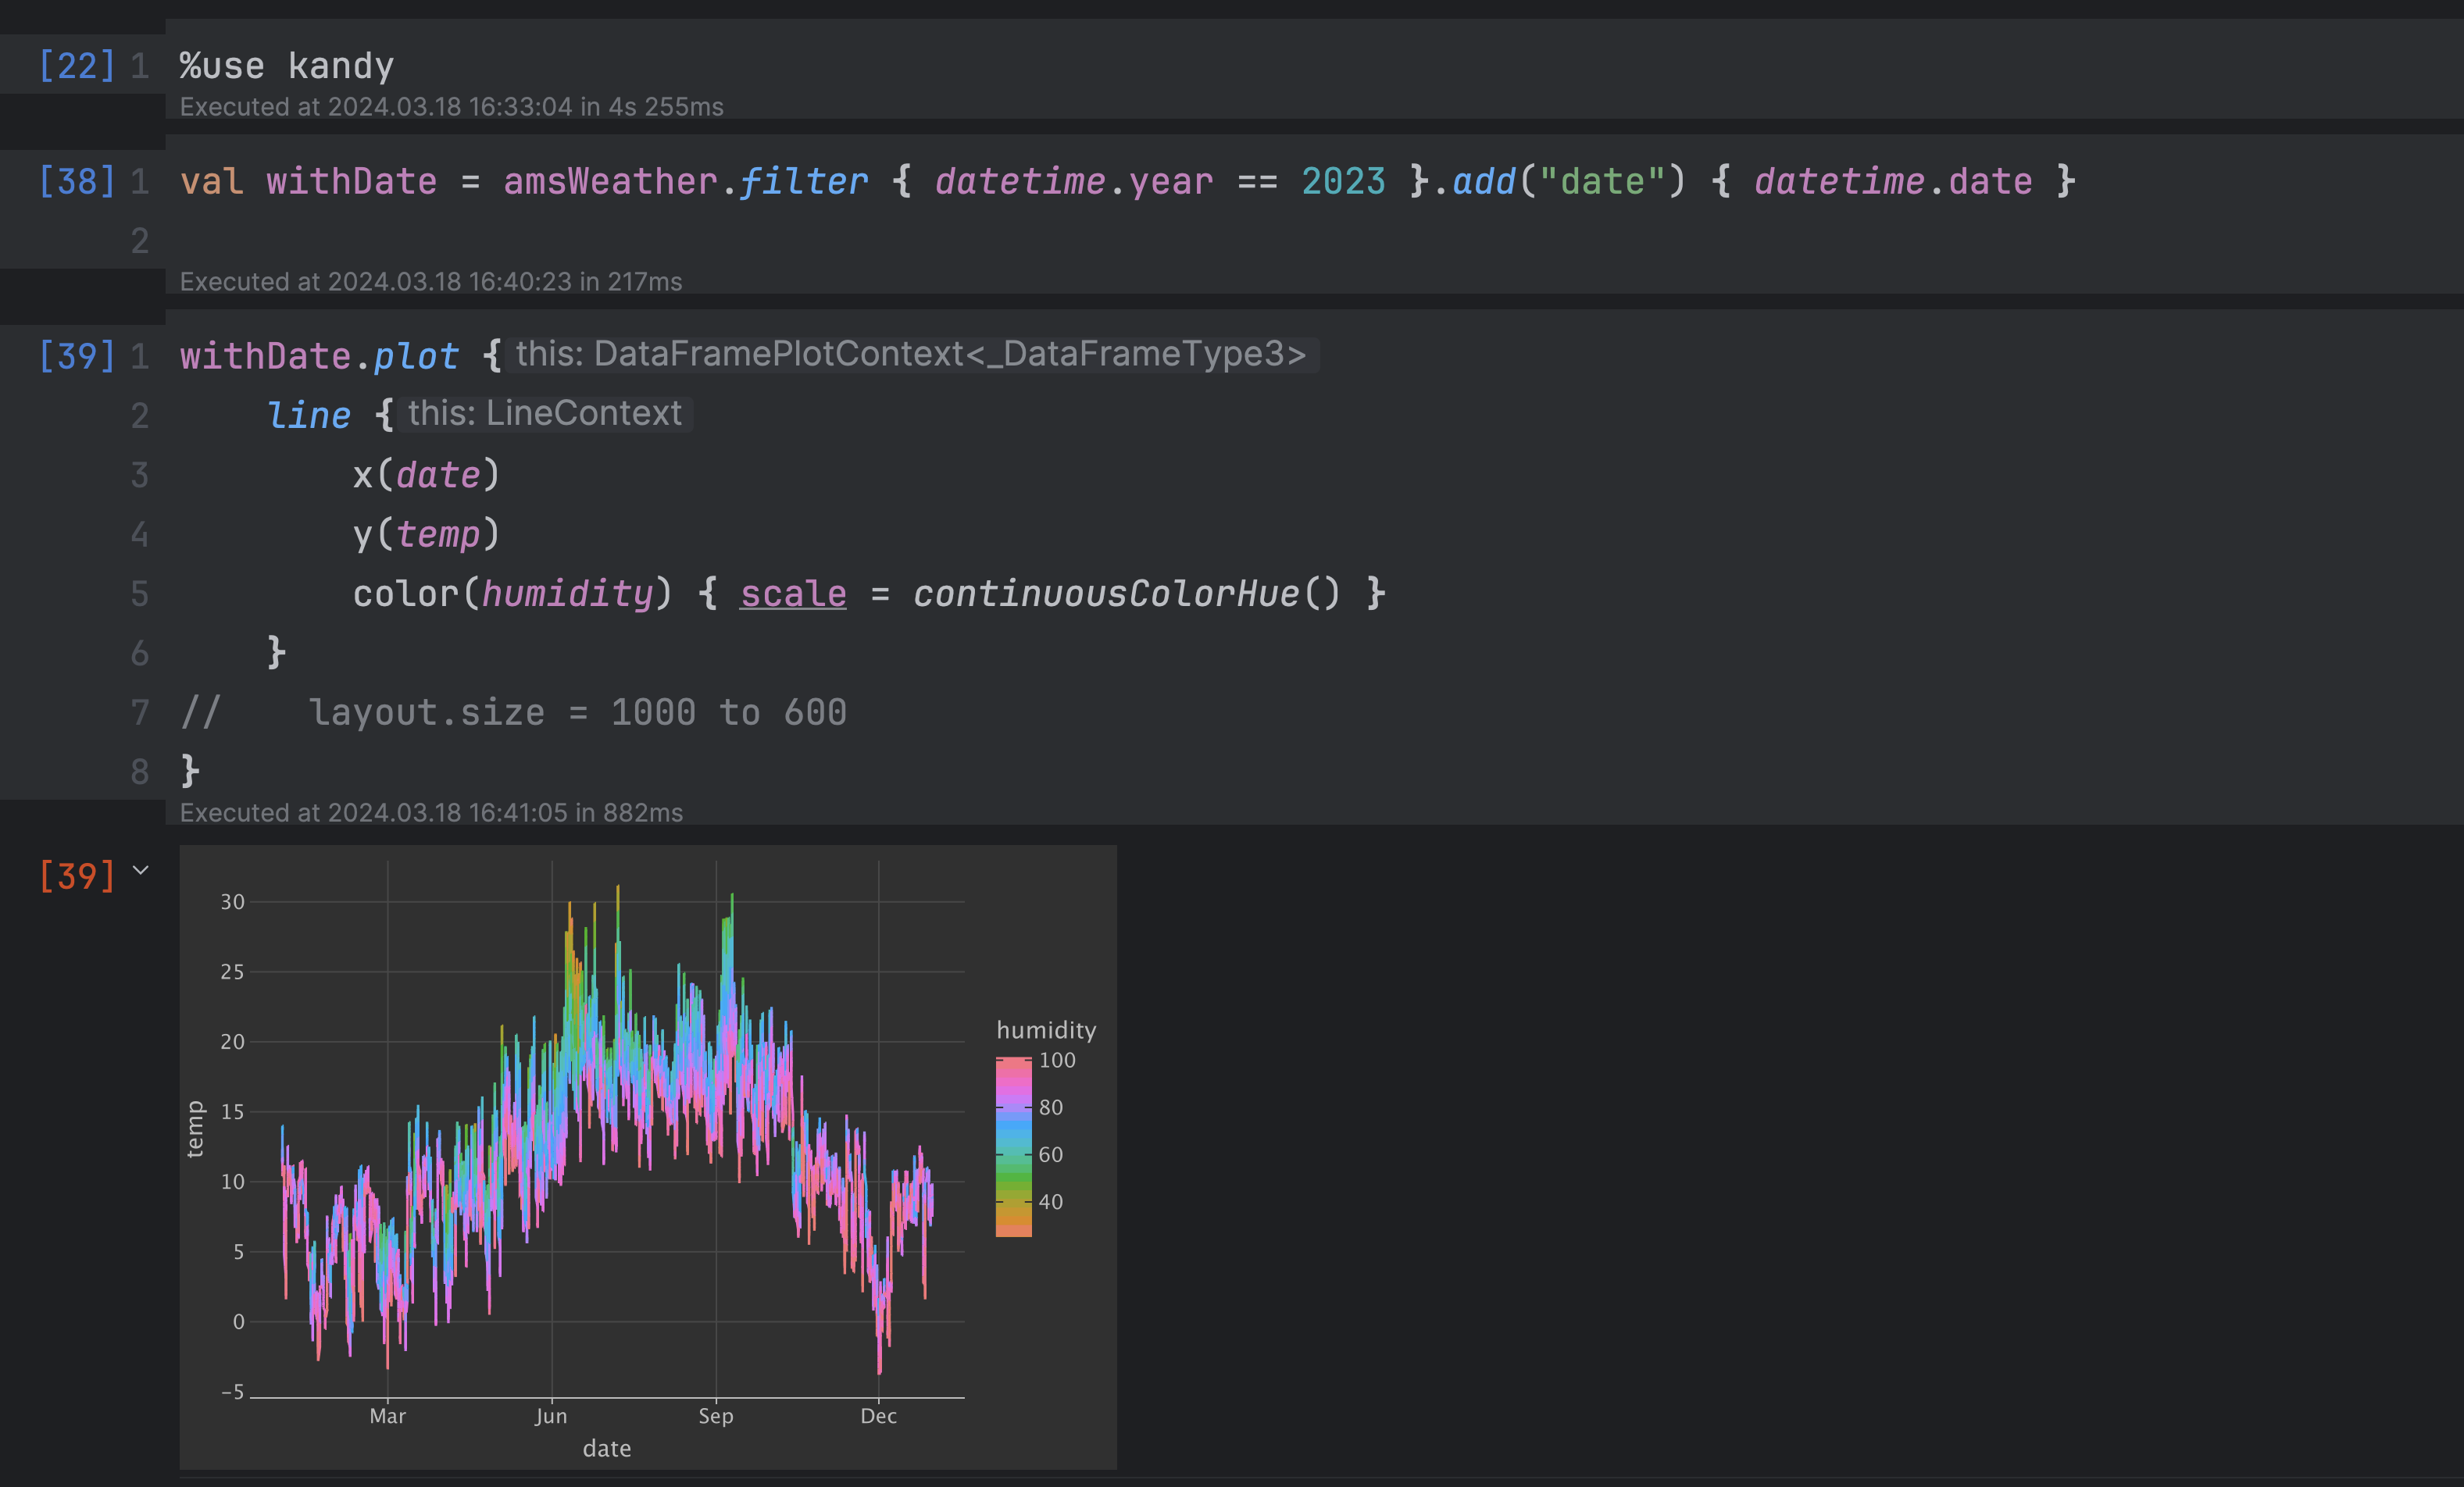
To start using Kandy with Kotlin Notebook, add the ‘%use kandy‘ line into a cell and execute it. This will automatically load the latest stable version of Kandy, add all necessary imports, and add plot rendering.
For DataFrame, Kandy provides the ‘plot‘ extension function to visualize data. This will help us to plot the graphs in our example quickly.
For instance, let’s plot the temperature values by date. For that, we only need to choose the graph type, ‘line’, and map the values: temperature values are mapped to the y-axis, and years will appear on the x-axis. Additionally, we can choose to change the color of the plot line depending on the humidity – this will give insight into the correlation between temperature and humidity. Looking at the result, we can conclude that the lower the temperature, the more humid it is.
Summary
Kotlin notebooks are interactive worksheets with a wide variety of outputs that allow you to explore and experiment with your Kotlin code without additional environment setup.
With the help of integrated libraries, such as Kotlin DataFrame and Kandy, you can explore, visualize, find patterns, and learn interesting facts about your data. You can get started with Kotlin Notebook quickly by exploring the repository with examples presented in the article.
To learn more about Kotlin for data science, check the entry page in the documentation and join #datascience channel in Kotlin Slack.